South American vs Kiowa Householder Income Over 65 years
COMPARE
South American
Kiowa
Householder Income Over 65 years
Householder Income Over 65 years Comparison
South Americans
Kiowa
$59,854
HOUSEHOLDER INCOME OVER 65 YEARS
23.8/ 100
METRIC RATING
192nd/ 347
METRIC RANK
$51,140
HOUSEHOLDER INCOME OVER 65 YEARS
0.0/ 100
METRIC RATING
326th/ 347
METRIC RANK
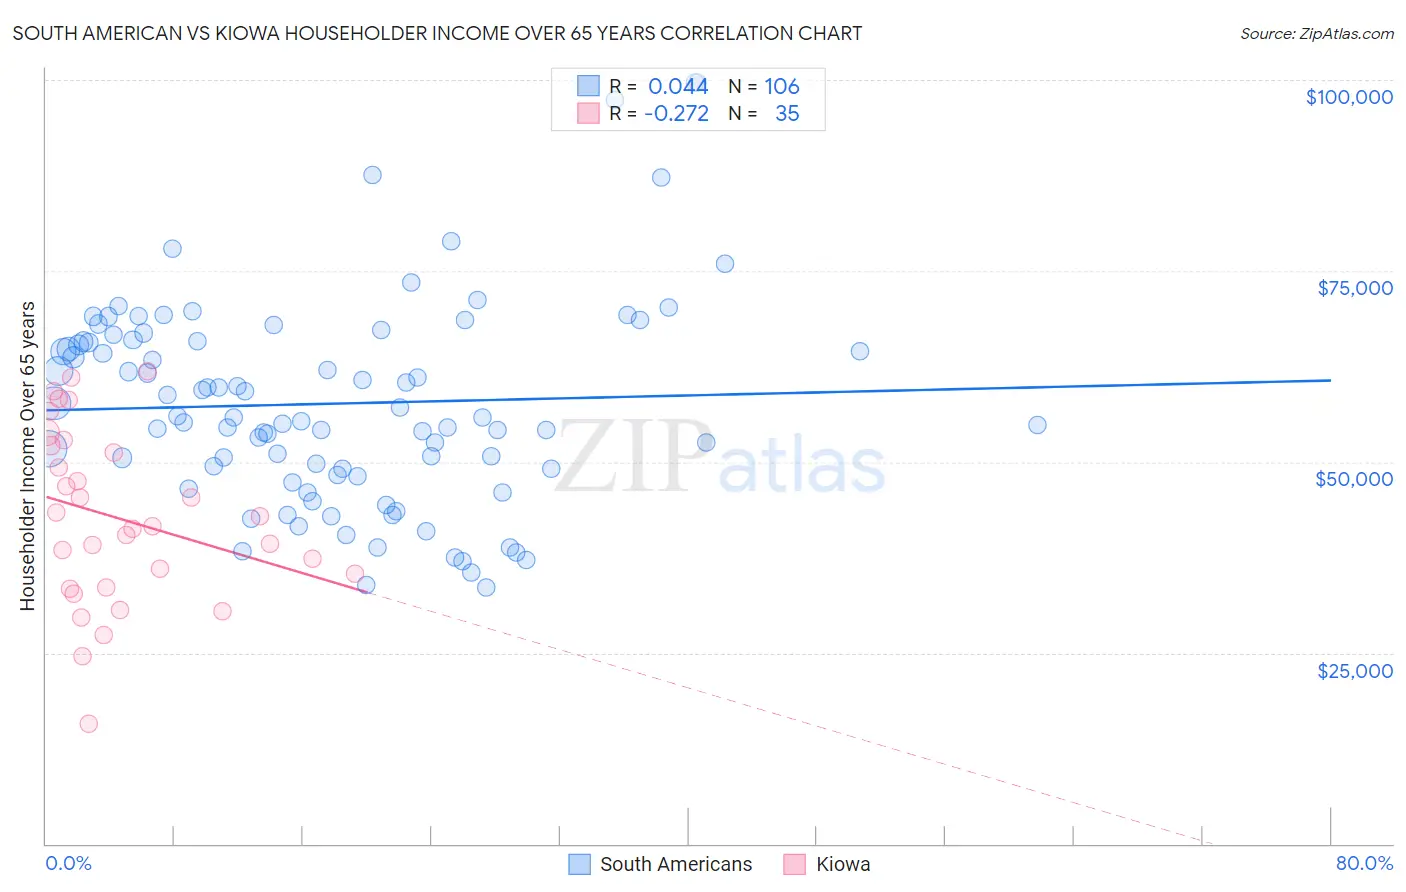
South American vs Kiowa Householder Income Over 65 years Correlation Chart
The statistical analysis conducted on geographies consisting of 491,344,983 people shows no correlation between the proportion of South Americans and household income with householder over the age of 65 in the United States with a correlation coefficient (R) of 0.044 and weighted average of $59,854. Similarly, the statistical analysis conducted on geographies consisting of 56,056,100 people shows a weak negative correlation between the proportion of Kiowa and household income with householder over the age of 65 in the United States with a correlation coefficient (R) of -0.272 and weighted average of $51,140, a difference of 17.0%.
Householder Income Over 65 years Correlation Summary
| Measurement | South American | Kiowa |
| Minimum | $33,510 | $15,714 |
| Maximum | $99,659 | $61,875 |
| Range | $66,149 | $46,161 |
| Mean | $57,616 | $42,635 |
| Median | $55,802 | $41,563 |
| Interquartile 25% (IQ1) | $49,066 | $33,542 |
| Interquartile 75% (IQ3) | $65,825 | $52,128 |
| Interquartile Range (IQR) | $16,759 | $18,586 |
| Standard Deviation (Sample) | $13,490 | $11,308 |
| Standard Deviation (Population) | $13,426 | $11,146 |
Similar Demographics by Householder Income Over 65 years
Demographics Similar to South Americans by Householder Income Over 65 years
In terms of householder income over 65 years, the demographic groups most similar to South Americans are Immigrants from Costa Rica ($59,848, a difference of 0.010%), Immigrants from Africa ($59,837, a difference of 0.030%), Immigrants from Iraq ($59,824, a difference of 0.050%), Belgian ($59,915, a difference of 0.10%), and Puget Sound Salish ($59,934, a difference of 0.13%).
| Demographics | Rating | Rank | Householder Income Over 65 years |
| Albanians | 32.0 /100 | #185 | Fair $60,249 |
| Slovenes | 31.8 /100 | #186 | Fair $60,241 |
| Immigrants | Thailand | 31.3 /100 | #187 | Fair $60,217 |
| Immigrants | Eritrea | 28.6 /100 | #188 | Fair $60,096 |
| Ghanaians | 27.5 /100 | #189 | Fair $60,043 |
| Puget Sound Salish | 25.3 /100 | #190 | Fair $59,934 |
| Belgians | 24.9 /100 | #191 | Fair $59,915 |
| South Americans | 23.8 /100 | #192 | Fair $59,854 |
| Immigrants | Costa Rica | 23.6 /100 | #193 | Fair $59,848 |
| Immigrants | Africa | 23.4 /100 | #194 | Fair $59,837 |
| Immigrants | Iraq | 23.2 /100 | #195 | Fair $59,824 |
| Germans | 21.5 /100 | #196 | Fair $59,730 |
| Immigrants | Kenya | 21.1 /100 | #197 | Fair $59,710 |
| Moroccans | 20.7 /100 | #198 | Fair $59,683 |
| Immigrants | Immigrants | 20.2 /100 | #199 | Fair $59,656 |
Demographics Similar to Kiowa by Householder Income Over 65 years
In terms of householder income over 65 years, the demographic groups most similar to Kiowa are Immigrants from Haiti ($51,219, a difference of 0.15%), Bahamian ($51,000, a difference of 0.28%), Hopi ($50,925, a difference of 0.42%), Immigrants from Congo ($51,393, a difference of 0.49%), and Cajun ($51,397, a difference of 0.50%).
| Demographics | Rating | Rank | Householder Income Over 65 years |
| Immigrants | Honduras | 0.0 /100 | #319 | Tragic $51,888 |
| Colville | 0.0 /100 | #320 | Tragic $51,739 |
| Menominee | 0.0 /100 | #321 | Tragic $51,719 |
| British West Indians | 0.0 /100 | #322 | Tragic $51,463 |
| Cajuns | 0.0 /100 | #323 | Tragic $51,397 |
| Immigrants | Congo | 0.0 /100 | #324 | Tragic $51,393 |
| Immigrants | Haiti | 0.0 /100 | #325 | Tragic $51,219 |
| Kiowa | 0.0 /100 | #326 | Tragic $51,140 |
| Bahamians | 0.0 /100 | #327 | Tragic $51,000 |
| Hopi | 0.0 /100 | #328 | Tragic $50,925 |
| Blacks/African Americans | 0.0 /100 | #329 | Tragic $50,779 |
| Immigrants | Grenada | 0.0 /100 | #330 | Tragic $50,747 |
| Pima | 0.0 /100 | #331 | Tragic $50,539 |
| Dutch West Indians | 0.0 /100 | #332 | Tragic $50,475 |
| Cape Verdeans | 0.0 /100 | #333 | Tragic $50,077 |