Immigrants from Caribbean vs Italian Median Female Earnings
COMPARE
Immigrants from Caribbean
Italian
Median Female Earnings
Median Female Earnings Comparison
Immigrants from Caribbean
Italians
$36,414
MEDIAN FEMALE EARNINGS
0.1/ 100
METRIC RATING
279th/ 347
METRIC RANK
$41,505
MEDIAN FEMALE EARNINGS
97.7/ 100
METRIC RATING
105th/ 347
METRIC RANK
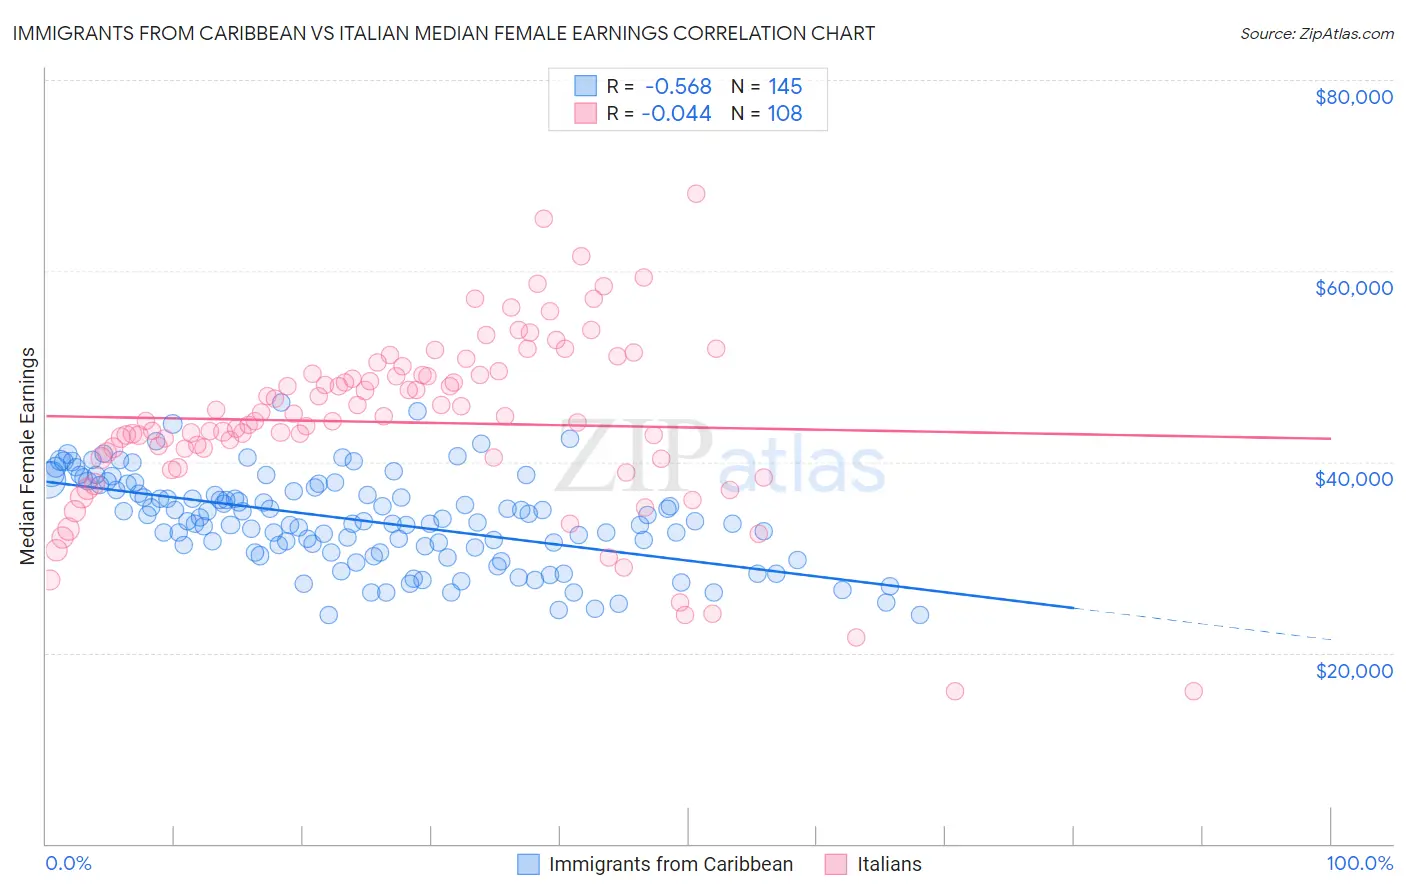
Immigrants from Caribbean vs Italian Median Female Earnings Correlation Chart
The statistical analysis conducted on geographies consisting of 449,719,186 people shows a substantial negative correlation between the proportion of Immigrants from Caribbean and median female earnings in the United States with a correlation coefficient (R) of -0.568 and weighted average of $36,414. Similarly, the statistical analysis conducted on geographies consisting of 573,135,086 people shows no correlation between the proportion of Italians and median female earnings in the United States with a correlation coefficient (R) of -0.044 and weighted average of $41,505, a difference of 14.0%.
Median Female Earnings Correlation Summary
| Measurement | Immigrants from Caribbean | Italian |
| Minimum | $23,937 | $15,938 |
| Maximum | $46,205 | $68,125 |
| Range | $22,268 | $52,187 |
| Mean | $33,887 | $44,140 |
| Median | $33,768 | $44,292 |
| Interquartile 25% (IQ1) | $30,791 | $40,427 |
| Interquartile 75% (IQ3) | $37,444 | $49,180 |
| Interquartile Range (IQR) | $6,654 | $8,753 |
| Standard Deviation (Sample) | $4,730 | $9,271 |
| Standard Deviation (Population) | $4,714 | $9,228 |
Similar Demographics by Median Female Earnings
Demographics Similar to Immigrants from Caribbean by Median Female Earnings
In terms of median female earnings, the demographic groups most similar to Immigrants from Caribbean are Iroquois ($36,408, a difference of 0.020%), U.S. Virgin Islander ($36,424, a difference of 0.030%), Spanish American ($36,391, a difference of 0.060%), Haitian ($36,374, a difference of 0.11%), and Marshallese ($36,459, a difference of 0.12%).
| Demographics | Rating | Rank | Median Female Earnings |
| Immigrants | Dominican Republic | 0.3 /100 | #272 | Tragic $36,857 |
| Immigrants | Laos | 0.3 /100 | #273 | Tragic $36,841 |
| Immigrants | El Salvador | 0.2 /100 | #274 | Tragic $36,673 |
| Africans | 0.1 /100 | #275 | Tragic $36,530 |
| Central Americans | 0.1 /100 | #276 | Tragic $36,492 |
| Marshallese | 0.1 /100 | #277 | Tragic $36,459 |
| U.S. Virgin Islanders | 0.1 /100 | #278 | Tragic $36,424 |
| Immigrants | Caribbean | 0.1 /100 | #279 | Tragic $36,414 |
| Iroquois | 0.1 /100 | #280 | Tragic $36,408 |
| Spanish Americans | 0.1 /100 | #281 | Tragic $36,391 |
| Haitians | 0.1 /100 | #282 | Tragic $36,374 |
| Immigrants | Haiti | 0.1 /100 | #283 | Tragic $36,203 |
| Indonesians | 0.1 /100 | #284 | Tragic $36,140 |
| Paiute | 0.1 /100 | #285 | Tragic $36,056 |
| Osage | 0.0 /100 | #286 | Tragic $36,034 |
Demographics Similar to Italians by Median Female Earnings
In terms of median female earnings, the demographic groups most similar to Italians are Immigrants from Zimbabwe ($41,527, a difference of 0.050%), Immigrants from Eritrea ($41,485, a difference of 0.050%), Palestinian ($41,484, a difference of 0.050%), Jordanian ($41,464, a difference of 0.10%), and Chinese ($41,461, a difference of 0.10%).
| Demographics | Rating | Rank | Median Female Earnings |
| Immigrants | Scotland | 98.7 /100 | #98 | Exceptional $41,771 |
| Immigrants | Barbados | 98.4 /100 | #99 | Exceptional $41,685 |
| Romanians | 98.3 /100 | #100 | Exceptional $41,663 |
| Immigrants | Fiji | 98.3 /100 | #101 | Exceptional $41,656 |
| Immigrants | Poland | 98.2 /100 | #102 | Exceptional $41,630 |
| Immigrants | Argentina | 97.9 /100 | #103 | Exceptional $41,554 |
| Immigrants | Zimbabwe | 97.8 /100 | #104 | Exceptional $41,527 |
| Italians | 97.7 /100 | #105 | Exceptional $41,505 |
| Immigrants | Eritrea | 97.6 /100 | #106 | Exceptional $41,485 |
| Palestinians | 97.6 /100 | #107 | Exceptional $41,484 |
| Jordanians | 97.5 /100 | #108 | Exceptional $41,464 |
| Chinese | 97.5 /100 | #109 | Exceptional $41,461 |
| Immigrants | Western Asia | 97.0 /100 | #110 | Exceptional $41,375 |
| Immigrants | Canada | 97.0 /100 | #111 | Exceptional $41,373 |
| Immigrants | North America | 96.7 /100 | #112 | Exceptional $41,319 |