Immigrants from Barbados vs Immigrants from Syria Per Capita Income
COMPARE
Immigrants from Barbados
Immigrants from Syria
Per Capita Income
Per Capita Income Comparison
Immigrants from Barbados
Immigrants from Syria
$41,478
PER CAPITA INCOME
7.9/ 100
METRIC RATING
220th/ 347
METRIC RANK
$45,218
PER CAPITA INCOME
85.2/ 100
METRIC RATING
137th/ 347
METRIC RANK
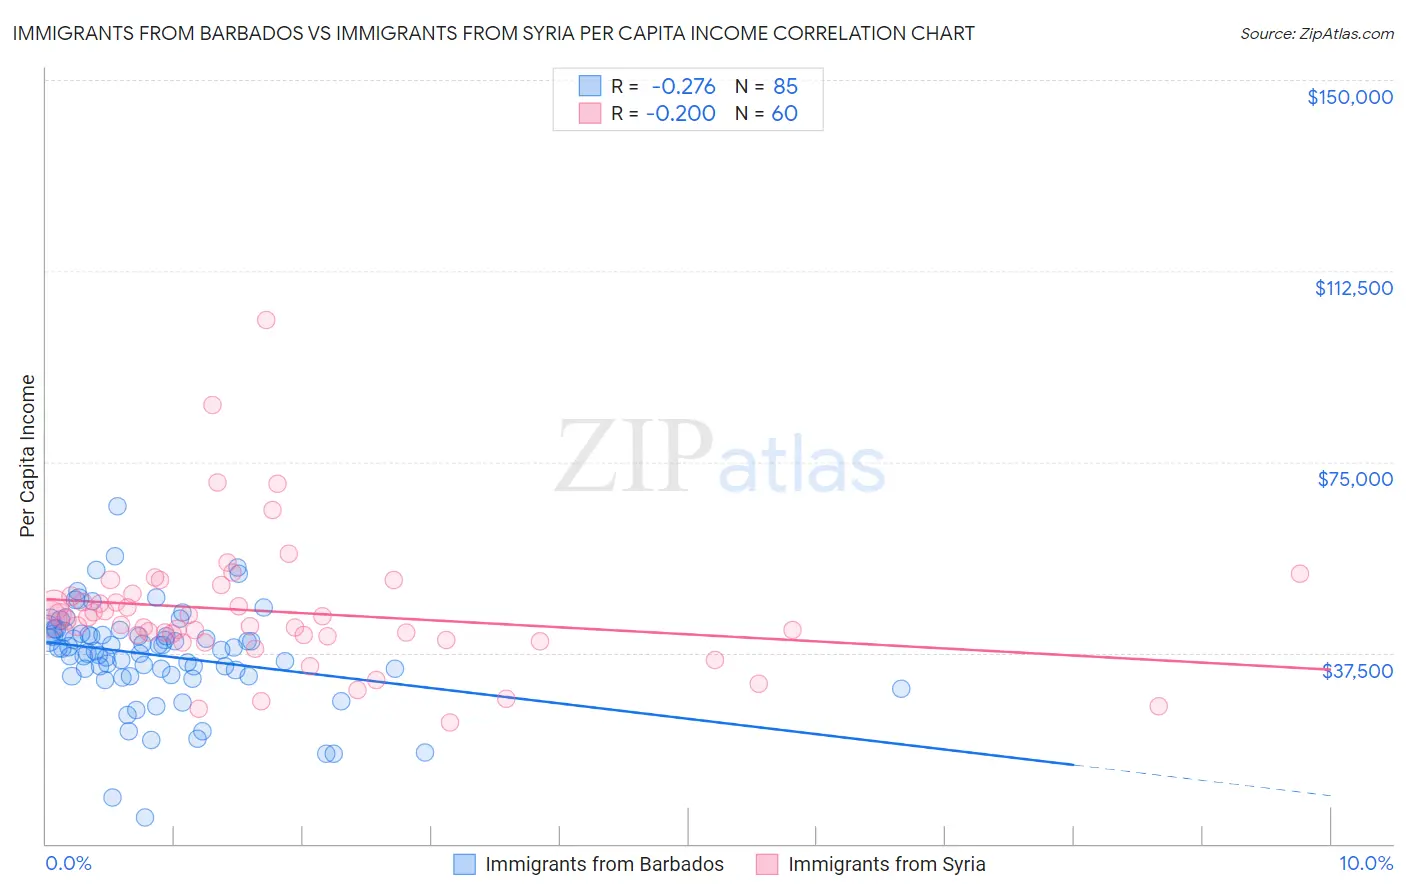
Immigrants from Barbados vs Immigrants from Syria Per Capita Income Correlation Chart
The statistical analysis conducted on geographies consisting of 112,709,172 people shows a weak negative correlation between the proportion of Immigrants from Barbados and per capita income in the United States with a correlation coefficient (R) of -0.276 and weighted average of $41,478. Similarly, the statistical analysis conducted on geographies consisting of 174,111,110 people shows a poor negative correlation between the proportion of Immigrants from Syria and per capita income in the United States with a correlation coefficient (R) of -0.200 and weighted average of $45,218, a difference of 9.0%.
Per Capita Income Correlation Summary
| Measurement | Immigrants from Barbados | Immigrants from Syria |
| Minimum | $5,075 | $23,901 |
| Maximum | $66,187 | $102,814 |
| Range | $61,112 | $78,913 |
| Mean | $37,004 | $45,572 |
| Median | $38,335 | $43,422 |
| Interquartile 25% (IQ1) | $33,039 | $40,433 |
| Interquartile 75% (IQ3) | $41,445 | $48,863 |
| Interquartile Range (IQR) | $8,406 | $8,430 |
| Standard Deviation (Sample) | $9,798 | $13,127 |
| Standard Deviation (Population) | $9,740 | $13,017 |
Similar Demographics by Per Capita Income
Demographics Similar to Immigrants from Barbados by Per Capita Income
In terms of per capita income, the demographic groups most similar to Immigrants from Barbados are Immigrants from Trinidad and Tobago ($41,476, a difference of 0.0%), Puget Sound Salish ($41,495, a difference of 0.040%), Immigrants from Iraq ($41,365, a difference of 0.27%), Immigrants from Cameroon ($41,334, a difference of 0.35%), and Trinidadian and Tobagonian ($41,655, a difference of 0.43%).
| Demographics | Rating | Rank | Per Capita Income |
| Immigrants | Venezuela | 10.2 /100 | #213 | Poor $41,727 |
| Immigrants | Bangladesh | 10.1 /100 | #214 | Poor $41,709 |
| Sudanese | 9.9 /100 | #215 | Tragic $41,695 |
| Tongans | 9.9 /100 | #216 | Tragic $41,693 |
| Guamanians/Chamorros | 9.7 /100 | #217 | Tragic $41,678 |
| Trinidadians and Tobagonians | 9.5 /100 | #218 | Tragic $41,655 |
| Puget Sound Salish | 8.1 /100 | #219 | Tragic $41,495 |
| Immigrants | Barbados | 7.9 /100 | #220 | Tragic $41,478 |
| Immigrants | Trinidad and Tobago | 7.9 /100 | #221 | Tragic $41,476 |
| Immigrants | Iraq | 7.1 /100 | #222 | Tragic $41,365 |
| Immigrants | Cameroon | 6.8 /100 | #223 | Tragic $41,334 |
| Immigrants | St. Vincent and the Grenadines | 6.4 /100 | #224 | Tragic $41,270 |
| West Indians | 6.0 /100 | #225 | Tragic $41,217 |
| Immigrants | Ecuador | 5.9 /100 | #226 | Tragic $41,195 |
| Immigrants | Ghana | 5.5 /100 | #227 | Tragic $41,131 |
Demographics Similar to Immigrants from Syria by Per Capita Income
In terms of per capita income, the demographic groups most similar to Immigrants from Syria are Immigrants from Oceania ($45,220, a difference of 0.0%), Assyrian/Chaldean/Syriac ($45,195, a difference of 0.050%), Basque ($45,086, a difference of 0.29%), Immigrants from Jordan ($45,066, a difference of 0.34%), and Slavic ($45,049, a difference of 0.38%).
| Demographics | Rating | Rank | Per Capita Income |
| Arabs | 90.4 /100 | #130 | Exceptional $45,662 |
| Immigrants | North Macedonia | 90.0 /100 | #131 | Exceptional $45,622 |
| Jordanians | 89.9 /100 | #132 | Excellent $45,605 |
| Pakistanis | 89.7 /100 | #133 | Excellent $45,587 |
| Slovenes | 89.6 /100 | #134 | Excellent $45,581 |
| Hungarians | 87.9 /100 | #135 | Excellent $45,426 |
| Immigrants | Oceania | 85.2 /100 | #136 | Excellent $45,220 |
| Immigrants | Syria | 85.2 /100 | #137 | Excellent $45,218 |
| Assyrians/Chaldeans/Syriacs | 84.8 /100 | #138 | Excellent $45,195 |
| Basques | 83.2 /100 | #139 | Excellent $45,086 |
| Immigrants | Jordan | 82.9 /100 | #140 | Excellent $45,066 |
| Slavs | 82.6 /100 | #141 | Excellent $45,049 |
| Ugandans | 82.6 /100 | #142 | Excellent $45,047 |
| Immigrants | Uganda | 82.5 /100 | #143 | Excellent $45,043 |
| Icelanders | 81.6 /100 | #144 | Excellent $44,987 |