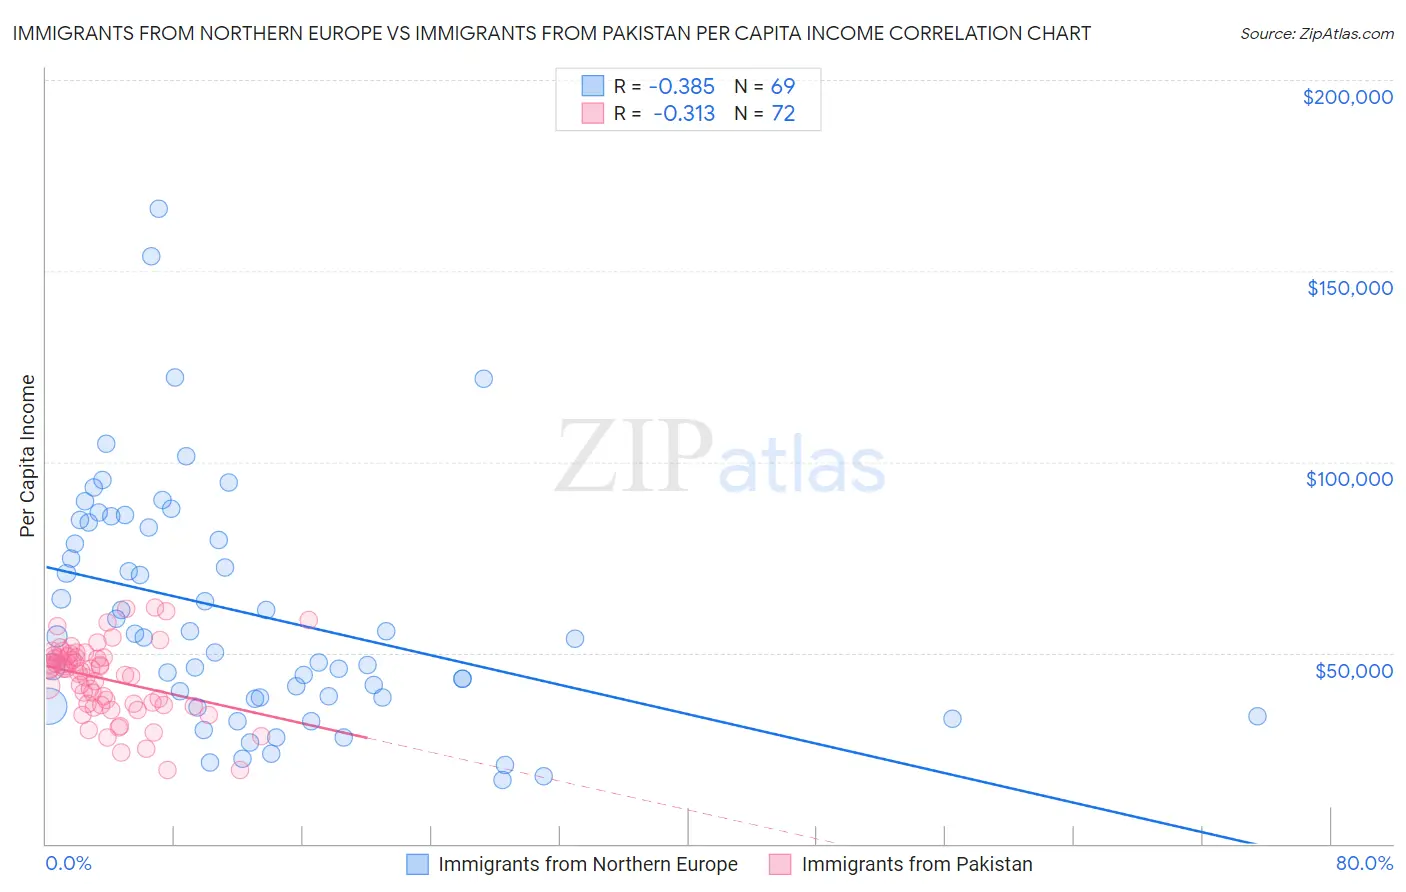
Immigrants from Northern Europe vs Immigrants from Pakistan Per Capita Income
COMPARE
Immigrants from Northern Europe
Immigrants from Pakistan
Per Capita Income
Per Capita Income Comparison
Immigrants from Northern Europe
Immigrants from Pakistan
$54,159
PER CAPITA INCOME
100.0/ 100
METRIC RATING
21st/ 347
METRIC RANK
$47,084
PER CAPITA INCOME
97.9/ 100
METRIC RATING
98th/ 347
METRIC RANK
Immigrants from Northern Europe vs Immigrants from Pakistan Per Capita Income Correlation Chart
The statistical analysis conducted on geographies consisting of 477,262,746 people shows a mild negative correlation between the proportion of Immigrants from Northern Europe and per capita income in the United States with a correlation coefficient (R) of -0.385 and weighted average of $54,159. Similarly, the statistical analysis conducted on geographies consisting of 283,918,020 people shows a mild negative correlation between the proportion of Immigrants from Pakistan and per capita income in the United States with a correlation coefficient (R) of -0.313 and weighted average of $47,084, a difference of 15.0%.
Per Capita Income Correlation Summary
| Measurement | Immigrants from Northern Europe | Immigrants from Pakistan |
| Minimum | $16,541 | $19,245 |
| Maximum | $166,372 | $61,776 |
| Range | $149,831 | $42,531 |
| Mean | $60,222 | $43,079 |
| Median | $53,889 | $45,819 |
| Interquartile 25% (IQ1) | $38,162 | $36,516 |
| Interquartile 75% (IQ3) | $83,485 | $48,924 |
| Interquartile Range (IQR) | $45,324 | $12,409 |
| Standard Deviation (Sample) | $31,097 | $9,561 |
| Standard Deviation (Population) | $30,871 | $9,495 |
Similar Demographics by Per Capita Income
Demographics Similar to Immigrants from Northern Europe by Per Capita Income
In terms of per capita income, the demographic groups most similar to Immigrants from Northern Europe are Soviet Union ($54,202, a difference of 0.080%), Immigrants from China ($54,264, a difference of 0.19%), Thai ($54,307, a difference of 0.27%), Indian (Asian) ($53,874, a difference of 0.53%), and Immigrants from Eastern Asia ($53,806, a difference of 0.66%).
| Demographics | Rating | Rank | Per Capita Income |
| Immigrants | Belgium | 100.0 /100 | #14 | Exceptional $55,082 |
| Cypriots | 100.0 /100 | #15 | Exceptional $54,899 |
| Immigrants | Switzerland | 100.0 /100 | #16 | Exceptional $54,866 |
| Immigrants | France | 100.0 /100 | #17 | Exceptional $54,557 |
| Thais | 100.0 /100 | #18 | Exceptional $54,307 |
| Immigrants | China | 100.0 /100 | #19 | Exceptional $54,264 |
| Soviet Union | 100.0 /100 | #20 | Exceptional $54,202 |
| Immigrants | Northern Europe | 100.0 /100 | #21 | Exceptional $54,159 |
| Indians (Asian) | 100.0 /100 | #22 | Exceptional $53,874 |
| Immigrants | Eastern Asia | 100.0 /100 | #23 | Exceptional $53,806 |
| Immigrants | Denmark | 100.0 /100 | #24 | Exceptional $53,799 |
| Immigrants | Japan | 100.0 /100 | #25 | Exceptional $53,359 |
| Russians | 100.0 /100 | #26 | Exceptional $53,154 |
| Immigrants | South Central Asia | 100.0 /100 | #27 | Exceptional $52,660 |
| Latvians | 100.0 /100 | #28 | Exceptional $52,649 |
Demographics Similar to Immigrants from Pakistan by Per Capita Income
In terms of per capita income, the demographic groups most similar to Immigrants from Pakistan are Laotian ($47,041, a difference of 0.090%), Immigrants from Lebanon ($46,938, a difference of 0.31%), Immigrants from Uzbekistan ($46,929, a difference of 0.33%), Carpatho Rusyn ($47,248, a difference of 0.35%), and Alsatian ($47,284, a difference of 0.43%).
| Demographics | Rating | Rank | Per Capita Income |
| Macedonians | 98.8 /100 | #91 | Exceptional $47,573 |
| Immigrants | Moldova | 98.7 /100 | #92 | Exceptional $47,489 |
| Immigrants | Zimbabwe | 98.5 /100 | #93 | Exceptional $47,394 |
| Albanians | 98.5 /100 | #94 | Exceptional $47,379 |
| Immigrants | Egypt | 98.5 /100 | #95 | Exceptional $47,361 |
| Alsatians | 98.3 /100 | #96 | Exceptional $47,284 |
| Carpatho Rusyns | 98.2 /100 | #97 | Exceptional $47,248 |
| Immigrants | Pakistan | 97.9 /100 | #98 | Exceptional $47,084 |
| Laotians | 97.8 /100 | #99 | Exceptional $47,041 |
| Immigrants | Lebanon | 97.5 /100 | #100 | Exceptional $46,938 |
| Immigrants | Uzbekistan | 97.5 /100 | #101 | Exceptional $46,929 |
| Immigrants | Western Asia | 97.4 /100 | #102 | Exceptional $46,876 |
| Syrians | 97.2 /100 | #103 | Exceptional $46,837 |
| Brazilians | 96.8 /100 | #104 | Exceptional $46,700 |
| British | 96.3 /100 | #105 | Exceptional $46,571 |