Jamaican vs Immigrants from Pakistan Child Poverty Under the Age of 16
COMPARE
Jamaican
Immigrants from Pakistan
Child Poverty Under the Age of 16
Child Poverty Under the Age of 16 Comparison
Jamaicans
Immigrants from Pakistan
19.7%
CHILD POVERTY UNDER THE AGE OF 16
0.1/ 100
METRIC RATING
268th/ 347
METRIC RANK
14.1%
CHILD POVERTY UNDER THE AGE OF 16
98.6/ 100
METRIC RATING
58th/ 347
METRIC RANK
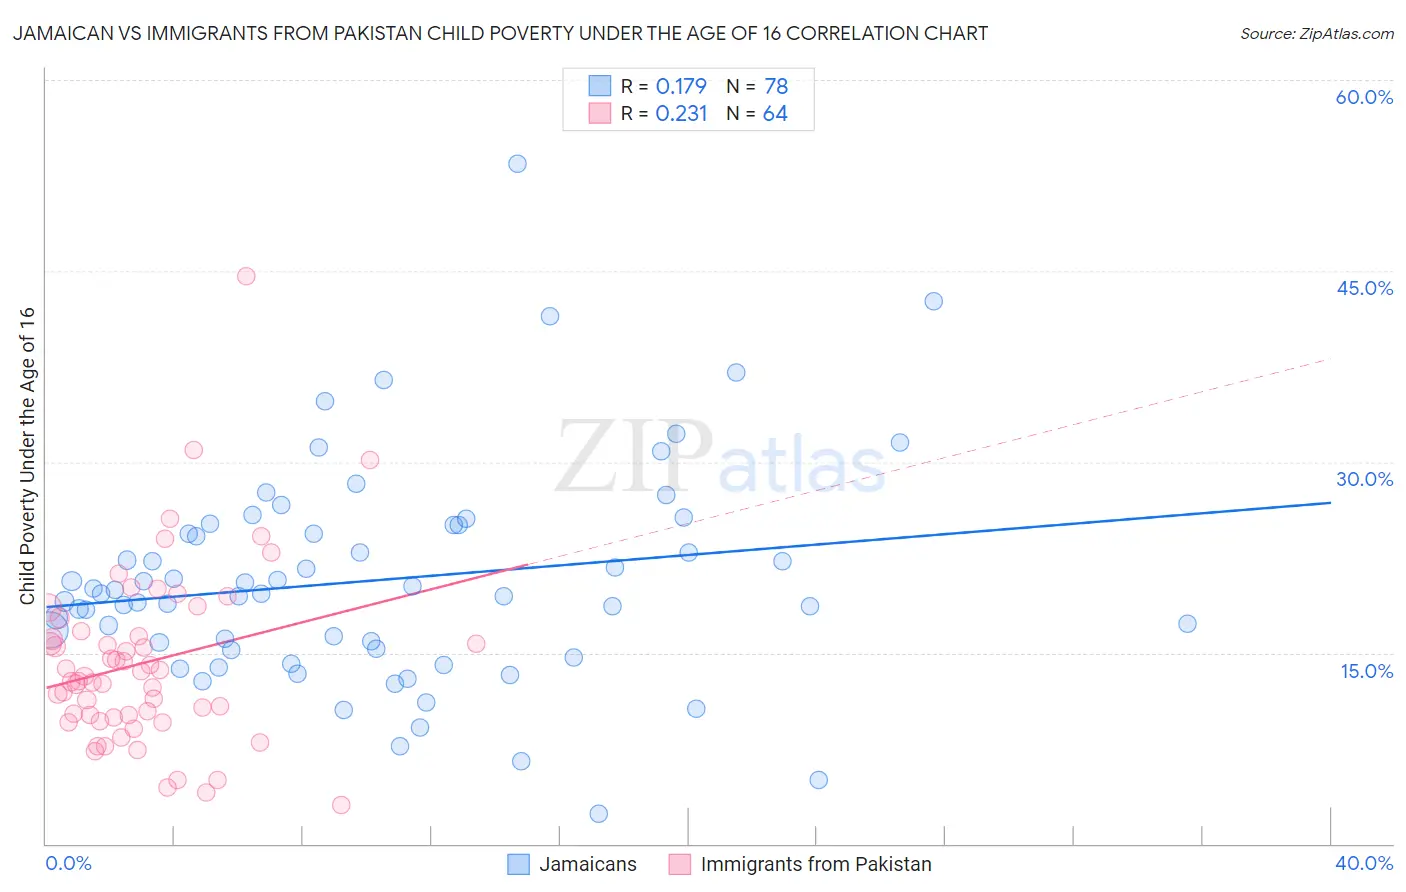
Jamaican vs Immigrants from Pakistan Child Poverty Under the Age of 16 Correlation Chart
The statistical analysis conducted on geographies consisting of 365,413,403 people shows a poor positive correlation between the proportion of Jamaicans and poverty level among children under the age of 16 in the United States with a correlation coefficient (R) of 0.179 and weighted average of 19.7%. Similarly, the statistical analysis conducted on geographies consisting of 282,211,286 people shows a weak positive correlation between the proportion of Immigrants from Pakistan and poverty level among children under the age of 16 in the United States with a correlation coefficient (R) of 0.231 and weighted average of 14.1%, a difference of 39.3%.
Child Poverty Under the Age of 16 Correlation Summary
| Measurement | Jamaican | Immigrants from Pakistan |
| Minimum | 2.4% | 3.1% |
| Maximum | 53.4% | 44.6% |
| Range | 51.0% | 41.6% |
| Mean | 20.7% | 14.2% |
| Median | 19.6% | 13.0% |
| Interquartile 25% (IQ1) | 15.3% | 10.0% |
| Interquartile 75% (IQ3) | 25.0% | 16.5% |
| Interquartile Range (IQR) | 9.7% | 6.5% |
| Standard Deviation (Sample) | 8.6% | 7.0% |
| Standard Deviation (Population) | 8.5% | 7.0% |
Similar Demographics by Child Poverty Under the Age of 16
Demographics Similar to Jamaicans by Child Poverty Under the Age of 16
In terms of child poverty under the age of 16, the demographic groups most similar to Jamaicans are Immigrants from El Salvador (19.7%, a difference of 0.060%), Spanish American Indian (19.7%, a difference of 0.080%), Immigrants from Liberia (19.7%, a difference of 0.21%), Immigrants from Bangladesh (19.8%, a difference of 0.51%), and Cherokee (19.5%, a difference of 0.66%).
| Demographics | Rating | Rank | Child Poverty Under the Age of 16 |
| Immigrants | Burma/Myanmar | 0.1 /100 | #261 | Tragic 19.4% |
| Immigrants | Guyana | 0.1 /100 | #262 | Tragic 19.4% |
| Vietnamese | 0.1 /100 | #263 | Tragic 19.4% |
| Immigrants | Ecuador | 0.1 /100 | #264 | Tragic 19.4% |
| Chickasaw | 0.1 /100 | #265 | Tragic 19.5% |
| Liberians | 0.1 /100 | #266 | Tragic 19.5% |
| Cherokee | 0.1 /100 | #267 | Tragic 19.5% |
| Jamaicans | 0.1 /100 | #268 | Tragic 19.7% |
| Immigrants | El Salvador | 0.1 /100 | #269 | Tragic 19.7% |
| Spanish American Indians | 0.1 /100 | #270 | Tragic 19.7% |
| Immigrants | Liberia | 0.1 /100 | #271 | Tragic 19.7% |
| Immigrants | Bangladesh | 0.1 /100 | #272 | Tragic 19.8% |
| Immigrants | Jamaica | 0.1 /100 | #273 | Tragic 19.8% |
| Immigrants | Cabo Verde | 0.1 /100 | #274 | Tragic 19.9% |
| Immigrants | Barbados | 0.1 /100 | #275 | Tragic 19.9% |
Demographics Similar to Immigrants from Pakistan by Child Poverty Under the Age of 16
In terms of child poverty under the age of 16, the demographic groups most similar to Immigrants from Pakistan are Scandinavian (14.1%, a difference of 0.010%), Immigrants from Belgium (14.1%, a difference of 0.020%), Immigrants from Serbia (14.1%, a difference of 0.11%), Immigrants from Austria (14.2%, a difference of 0.20%), and Immigrants from Sweden (14.2%, a difference of 0.24%).
| Demographics | Rating | Rank | Child Poverty Under the Age of 16 |
| Immigrants | Greece | 99.1 /100 | #51 | Exceptional 13.9% |
| Poles | 98.9 /100 | #52 | Exceptional 14.0% |
| Immigrants | Israel | 98.8 /100 | #53 | Exceptional 14.1% |
| Tsimshian | 98.8 /100 | #54 | Exceptional 14.1% |
| Immigrants | Indonesia | 98.7 /100 | #55 | Exceptional 14.1% |
| Immigrants | Serbia | 98.7 /100 | #56 | Exceptional 14.1% |
| Immigrants | Belgium | 98.6 /100 | #57 | Exceptional 14.1% |
| Immigrants | Pakistan | 98.6 /100 | #58 | Exceptional 14.1% |
| Scandinavians | 98.6 /100 | #59 | Exceptional 14.1% |
| Immigrants | Austria | 98.5 /100 | #60 | Exceptional 14.2% |
| Immigrants | Sweden | 98.5 /100 | #61 | Exceptional 14.2% |
| Zimbabweans | 98.5 /100 | #62 | Exceptional 14.2% |
| Immigrants | Europe | 98.4 /100 | #63 | Exceptional 14.2% |
| Immigrants | Romania | 98.3 /100 | #64 | Exceptional 14.2% |
| Immigrants | Philippines | 98.2 /100 | #65 | Exceptional 14.3% |