Jamaican vs Romanian Householder Income Ages 25 - 44 years
COMPARE
Jamaican
Romanian
Householder Income Ages 25 - 44 years
Householder Income Ages 25 - 44 years Comparison
Jamaicans
Romanians
$83,933
HOUSEHOLDER INCOME AGES 25 - 44 YEARS
0.3/ 100
METRIC RATING
270th/ 347
METRIC RANK
$102,544
HOUSEHOLDER INCOME AGES 25 - 44 YEARS
98.8/ 100
METRIC RATING
89th/ 347
METRIC RANK
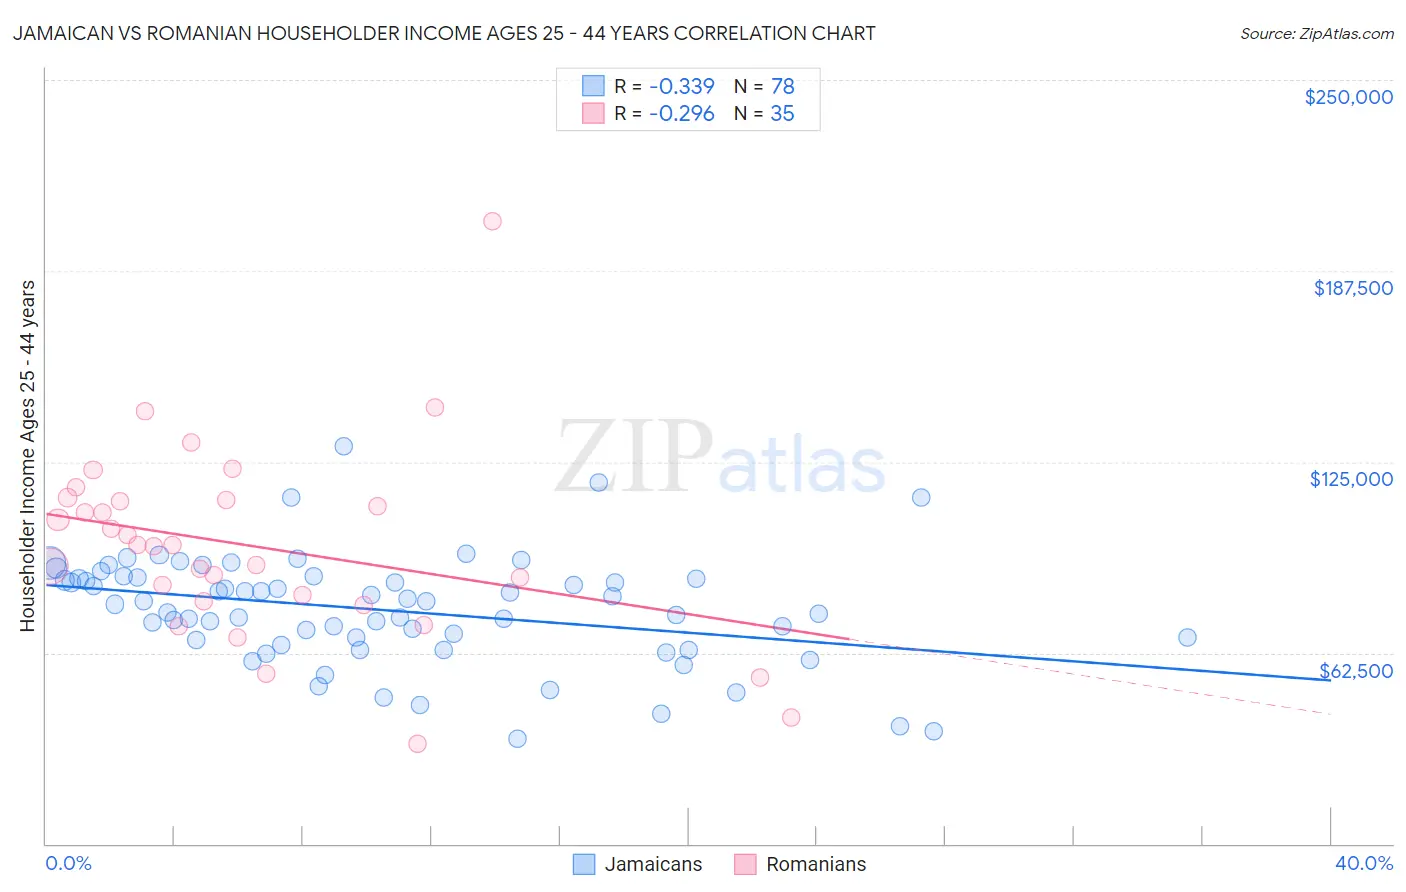
Jamaican vs Romanian Householder Income Ages 25 - 44 years Correlation Chart
The statistical analysis conducted on geographies consisting of 367,030,612 people shows a mild negative correlation between the proportion of Jamaicans and household income with householder between the ages 25 and 44 in the United States with a correlation coefficient (R) of -0.339 and weighted average of $83,933. Similarly, the statistical analysis conducted on geographies consisting of 376,787,035 people shows a weak negative correlation between the proportion of Romanians and household income with householder between the ages 25 and 44 in the United States with a correlation coefficient (R) of -0.296 and weighted average of $102,544, a difference of 22.2%.
Householder Income Ages 25 - 44 years Correlation Summary
| Measurement | Jamaican | Romanian |
| Minimum | $34,529 | $32,747 |
| Maximum | $130,290 | $203,625 |
| Range | $95,761 | $170,878 |
| Mean | $76,521 | $97,566 |
| Median | $78,807 | $97,861 |
| Interquartile 25% (IQ1) | $66,599 | $79,500 |
| Interquartile 75% (IQ3) | $86,908 | $112,321 |
| Interquartile Range (IQR) | $20,309 | $32,821 |
| Standard Deviation (Sample) | $17,827 | $31,574 |
| Standard Deviation (Population) | $17,712 | $31,119 |
Similar Demographics by Householder Income Ages 25 - 44 years
Demographics Similar to Jamaicans by Householder Income Ages 25 - 44 years
In terms of householder income ages 25 - 44 years, the demographic groups most similar to Jamaicans are Spanish American Indian ($84,085, a difference of 0.18%), Somali ($83,752, a difference of 0.22%), Spanish American ($83,722, a difference of 0.25%), Iroquois ($83,682, a difference of 0.30%), and Subsaharan African ($84,235, a difference of 0.36%).
| Demographics | Rating | Rank | Householder Income Ages 25 - 44 years |
| Belizeans | 0.4 /100 | #263 | Tragic $84,534 |
| Osage | 0.4 /100 | #264 | Tragic $84,461 |
| Sudanese | 0.4 /100 | #265 | Tragic $84,401 |
| Immigrants | Cabo Verde | 0.3 /100 | #266 | Tragic $84,304 |
| Hmong | 0.3 /100 | #267 | Tragic $84,258 |
| Sub-Saharan Africans | 0.3 /100 | #268 | Tragic $84,235 |
| Spanish American Indians | 0.3 /100 | #269 | Tragic $84,085 |
| Jamaicans | 0.3 /100 | #270 | Tragic $83,933 |
| Somalis | 0.2 /100 | #271 | Tragic $83,752 |
| Spanish Americans | 0.2 /100 | #272 | Tragic $83,722 |
| Iroquois | 0.2 /100 | #273 | Tragic $83,682 |
| Marshallese | 0.2 /100 | #274 | Tragic $83,575 |
| Immigrants | Jamaica | 0.2 /100 | #275 | Tragic $83,298 |
| Immigrants | Belize | 0.2 /100 | #276 | Tragic $83,141 |
| Paiute | 0.2 /100 | #277 | Tragic $82,984 |
Demographics Similar to Romanians by Householder Income Ages 25 - 44 years
In terms of householder income ages 25 - 44 years, the demographic groups most similar to Romanians are Immigrants from Canada ($102,616, a difference of 0.070%), Ukrainian ($102,451, a difference of 0.090%), Immigrants from Hungary ($102,655, a difference of 0.11%), Immigrants from Western Europe ($102,654, a difference of 0.11%), and Immigrants from Ukraine ($102,664, a difference of 0.12%).
| Demographics | Rating | Rank | Householder Income Ages 25 - 44 years |
| Immigrants | Serbia | 99.2 /100 | #82 | Exceptional $103,155 |
| Argentineans | 99.1 /100 | #83 | Exceptional $103,111 |
| Immigrants | Philippines | 99.0 /100 | #84 | Exceptional $102,910 |
| Immigrants | Ukraine | 98.9 /100 | #85 | Exceptional $102,664 |
| Immigrants | Hungary | 98.9 /100 | #86 | Exceptional $102,655 |
| Immigrants | Western Europe | 98.9 /100 | #87 | Exceptional $102,654 |
| Immigrants | Canada | 98.9 /100 | #88 | Exceptional $102,616 |
| Romanians | 98.8 /100 | #89 | Exceptional $102,544 |
| Ukrainians | 98.8 /100 | #90 | Exceptional $102,451 |
| Croatians | 98.7 /100 | #91 | Exceptional $102,414 |
| Immigrants | North America | 98.7 /100 | #92 | Exceptional $102,407 |
| Immigrants | England | 98.4 /100 | #93 | Exceptional $102,020 |
| Sri Lankans | 98.4 /100 | #94 | Exceptional $101,960 |
| Assyrians/Chaldeans/Syriacs | 98.3 /100 | #95 | Exceptional $101,936 |
| Macedonians | 98.3 /100 | #96 | Exceptional $101,882 |