Asian vs Immigrants from Ireland Householder Income Ages 25 - 44 years
COMPARE
Asian
Immigrants from Ireland
Householder Income Ages 25 - 44 years
Householder Income Ages 25 - 44 years Comparison
Asians
Immigrants from Ireland
$112,666
HOUSEHOLDER INCOME AGES 25 - 44 YEARS
100.0/ 100
METRIC RATING
21st/ 347
METRIC RANK
$120,333
HOUSEHOLDER INCOME AGES 25 - 44 YEARS
100.0/ 100
METRIC RATING
7th/ 347
METRIC RANK
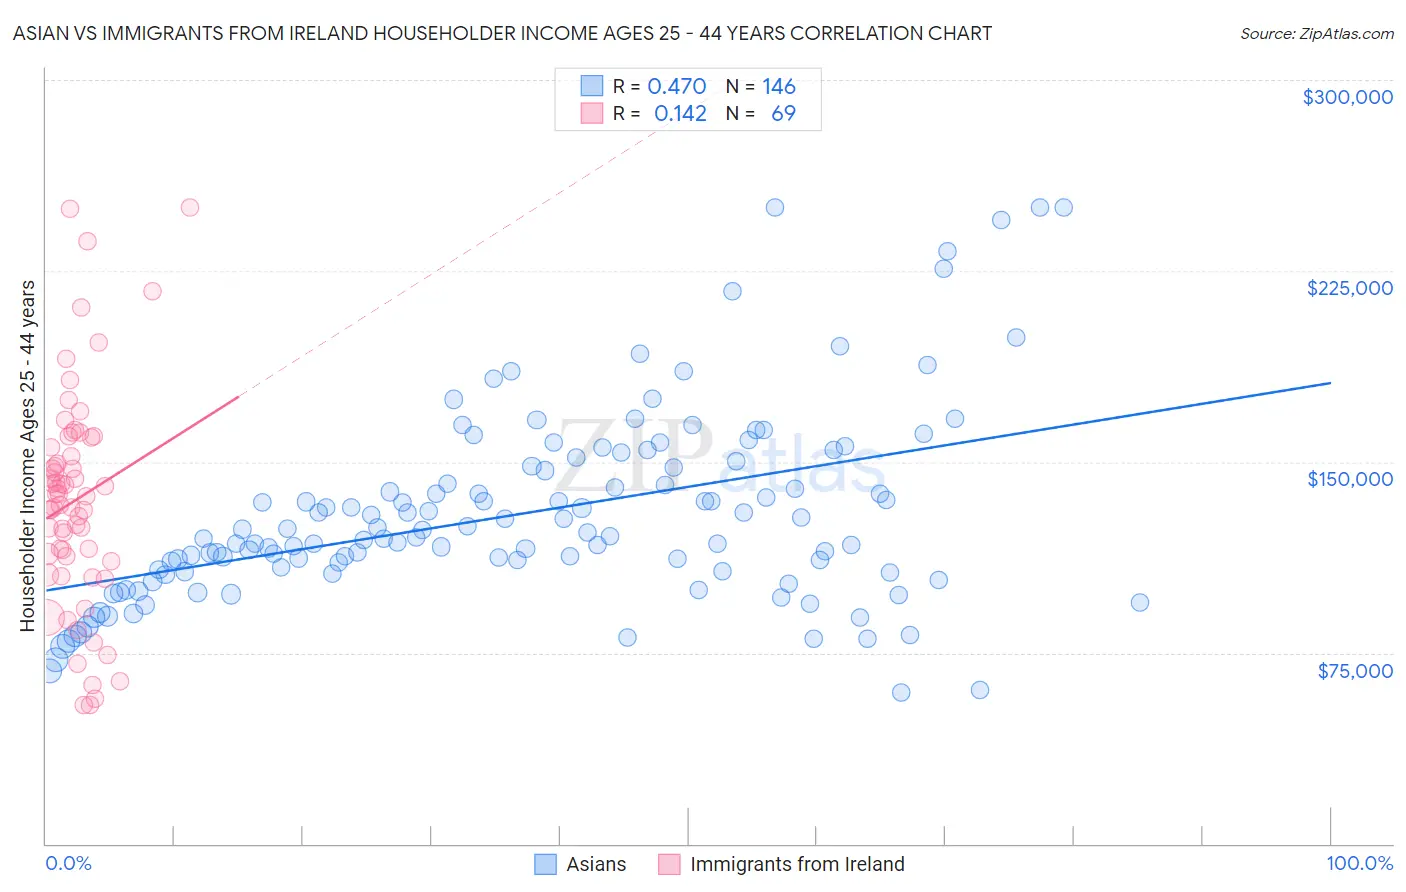
Asian vs Immigrants from Ireland Householder Income Ages 25 - 44 years Correlation Chart
The statistical analysis conducted on geographies consisting of 547,125,697 people shows a moderate positive correlation between the proportion of Asians and household income with householder between the ages 25 and 44 in the United States with a correlation coefficient (R) of 0.470 and weighted average of $112,666. Similarly, the statistical analysis conducted on geographies consisting of 240,342,740 people shows a poor positive correlation between the proportion of Immigrants from Ireland and household income with householder between the ages 25 and 44 in the United States with a correlation coefficient (R) of 0.142 and weighted average of $120,333, a difference of 6.8%.
Householder Income Ages 25 - 44 years Correlation Summary
| Measurement | Asian | Immigrants from Ireland |
| Minimum | $59,230 | $54,479 |
| Maximum | $250,001 | $250,001 |
| Range | $190,771 | $195,522 |
| Mean | $129,468 | $134,959 |
| Median | $120,546 | $136,656 |
| Interquartile 25% (IQ1) | $106,801 | $112,137 |
| Interquartile 75% (IQ3) | $147,804 | $157,677 |
| Interquartile Range (IQR) | $41,004 | $45,540 |
| Standard Deviation (Sample) | $37,581 | $42,676 |
| Standard Deviation (Population) | $37,452 | $42,366 |
Demographics Similar to Asians and Immigrants from Ireland by Householder Income Ages 25 - 44 years
In terms of householder income ages 25 - 44 years, the demographic groups most similar to Asians are Immigrants from Belgium ($112,575, a difference of 0.080%), Immigrants from Japan ($112,228, a difference of 0.39%), Immigrants from Sweden ($112,010, a difference of 0.59%), Immigrants from Korea ($113,401, a difference of 0.65%), and Burmese ($113,701, a difference of 0.92%). Similarly, the demographic groups most similar to Immigrants from Ireland are Iranian ($120,292, a difference of 0.030%), Immigrants from China ($119,756, a difference of 0.48%), Indian (Asian) ($119,496, a difference of 0.70%), Okinawan ($119,349, a difference of 0.82%), and Immigrants from Iran ($119,204, a difference of 0.95%).
| Demographics | Rating | Rank | Householder Income Ages 25 - 44 years |
| Immigrants | Singapore | 100.0 /100 | #4 | Exceptional $124,429 |
| Immigrants | India | 100.0 /100 | #5 | Exceptional $124,238 |
| Thais | 100.0 /100 | #6 | Exceptional $121,778 |
| Immigrants | Ireland | 100.0 /100 | #7 | Exceptional $120,333 |
| Iranians | 100.0 /100 | #8 | Exceptional $120,292 |
| Immigrants | China | 100.0 /100 | #9 | Exceptional $119,756 |
| Indians (Asian) | 100.0 /100 | #10 | Exceptional $119,496 |
| Okinawans | 100.0 /100 | #11 | Exceptional $119,349 |
| Immigrants | Iran | 100.0 /100 | #12 | Exceptional $119,204 |
| Immigrants | Eastern Asia | 100.0 /100 | #13 | Exceptional $118,056 |
| Immigrants | Israel | 100.0 /100 | #14 | Exceptional $117,219 |
| Immigrants | South Central Asia | 100.0 /100 | #15 | Exceptional $116,626 |
| Cypriots | 100.0 /100 | #16 | Exceptional $116,364 |
| Immigrants | Australia | 100.0 /100 | #17 | Exceptional $115,947 |
| Eastern Europeans | 100.0 /100 | #18 | Exceptional $114,523 |
| Burmese | 100.0 /100 | #19 | Exceptional $113,701 |
| Immigrants | Korea | 100.0 /100 | #20 | Exceptional $113,401 |
| Asians | 100.0 /100 | #21 | Exceptional $112,666 |
| Immigrants | Belgium | 100.0 /100 | #22 | Exceptional $112,575 |
| Immigrants | Japan | 100.0 /100 | #23 | Exceptional $112,228 |
| Immigrants | Sweden | 100.0 /100 | #24 | Exceptional $112,010 |