Jamaican vs Eastern European Householder Income Ages 25 - 44 years
COMPARE
Jamaican
Eastern European
Householder Income Ages 25 - 44 years
Householder Income Ages 25 - 44 years Comparison
Jamaicans
Eastern Europeans
$83,933
HOUSEHOLDER INCOME AGES 25 - 44 YEARS
0.3/ 100
METRIC RATING
270th/ 347
METRIC RANK
$114,523
HOUSEHOLDER INCOME AGES 25 - 44 YEARS
100.0/ 100
METRIC RATING
18th/ 347
METRIC RANK
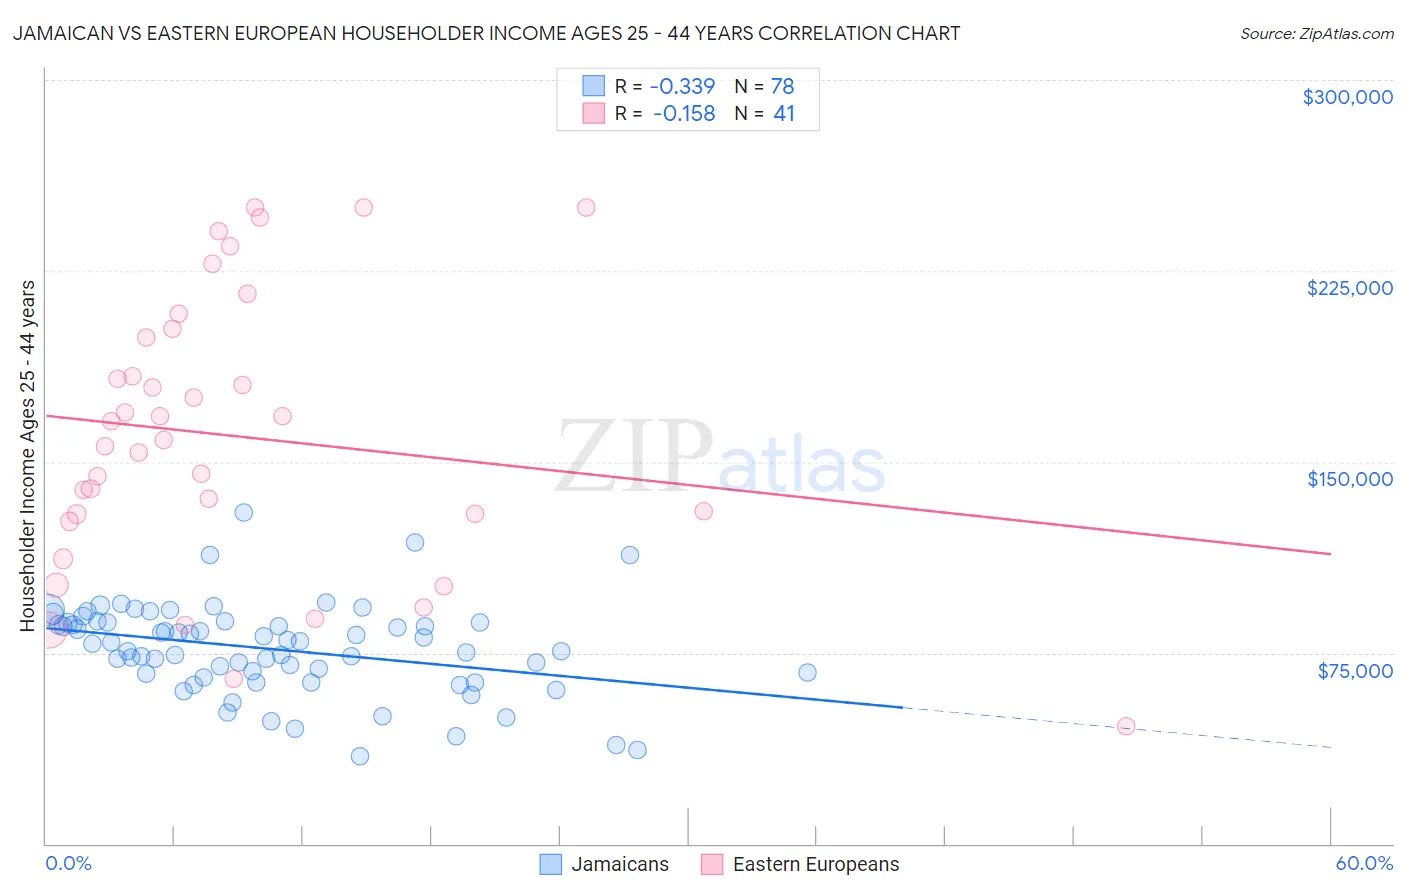
Jamaican vs Eastern European Householder Income Ages 25 - 44 years Correlation Chart
The statistical analysis conducted on geographies consisting of 367,030,612 people shows a mild negative correlation between the proportion of Jamaicans and household income with householder between the ages 25 and 44 in the United States with a correlation coefficient (R) of -0.339 and weighted average of $83,933. Similarly, the statistical analysis conducted on geographies consisting of 459,307,576 people shows a poor negative correlation between the proportion of Eastern Europeans and household income with householder between the ages 25 and 44 in the United States with a correlation coefficient (R) of -0.158 and weighted average of $114,523, a difference of 36.4%.
Householder Income Ages 25 - 44 years Correlation Summary
| Measurement | Jamaican | Eastern European |
| Minimum | $34,529 | $46,280 |
| Maximum | $130,290 | $250,001 |
| Range | $95,761 | $203,721 |
| Mean | $76,521 | $160,039 |
| Median | $78,807 | $158,530 |
| Interquartile 25% (IQ1) | $66,599 | $128,065 |
| Interquartile 75% (IQ3) | $86,908 | $200,429 |
| Interquartile Range (IQR) | $20,309 | $72,364 |
| Standard Deviation (Sample) | $17,827 | $54,167 |
| Standard Deviation (Population) | $17,712 | $53,502 |
Similar Demographics by Householder Income Ages 25 - 44 years
Demographics Similar to Jamaicans by Householder Income Ages 25 - 44 years
In terms of householder income ages 25 - 44 years, the demographic groups most similar to Jamaicans are Spanish American Indian ($84,085, a difference of 0.18%), Somali ($83,752, a difference of 0.22%), Spanish American ($83,722, a difference of 0.25%), Iroquois ($83,682, a difference of 0.30%), and Subsaharan African ($84,235, a difference of 0.36%).
| Demographics | Rating | Rank | Householder Income Ages 25 - 44 years |
| Belizeans | 0.4 /100 | #263 | Tragic $84,534 |
| Osage | 0.4 /100 | #264 | Tragic $84,461 |
| Sudanese | 0.4 /100 | #265 | Tragic $84,401 |
| Immigrants | Cabo Verde | 0.3 /100 | #266 | Tragic $84,304 |
| Hmong | 0.3 /100 | #267 | Tragic $84,258 |
| Sub-Saharan Africans | 0.3 /100 | #268 | Tragic $84,235 |
| Spanish American Indians | 0.3 /100 | #269 | Tragic $84,085 |
| Jamaicans | 0.3 /100 | #270 | Tragic $83,933 |
| Somalis | 0.2 /100 | #271 | Tragic $83,752 |
| Spanish Americans | 0.2 /100 | #272 | Tragic $83,722 |
| Iroquois | 0.2 /100 | #273 | Tragic $83,682 |
| Marshallese | 0.2 /100 | #274 | Tragic $83,575 |
| Immigrants | Jamaica | 0.2 /100 | #275 | Tragic $83,298 |
| Immigrants | Belize | 0.2 /100 | #276 | Tragic $83,141 |
| Paiute | 0.2 /100 | #277 | Tragic $82,984 |
Demographics Similar to Eastern Europeans by Householder Income Ages 25 - 44 years
In terms of householder income ages 25 - 44 years, the demographic groups most similar to Eastern Europeans are Burmese ($113,701, a difference of 0.72%), Immigrants from Korea ($113,401, a difference of 0.99%), Immigrants from Australia ($115,947, a difference of 1.2%), Cypriot ($116,364, a difference of 1.6%), and Asian ($112,666, a difference of 1.7%).
| Demographics | Rating | Rank | Householder Income Ages 25 - 44 years |
| Okinawans | 100.0 /100 | #11 | Exceptional $119,349 |
| Immigrants | Iran | 100.0 /100 | #12 | Exceptional $119,204 |
| Immigrants | Eastern Asia | 100.0 /100 | #13 | Exceptional $118,056 |
| Immigrants | Israel | 100.0 /100 | #14 | Exceptional $117,219 |
| Immigrants | South Central Asia | 100.0 /100 | #15 | Exceptional $116,626 |
| Cypriots | 100.0 /100 | #16 | Exceptional $116,364 |
| Immigrants | Australia | 100.0 /100 | #17 | Exceptional $115,947 |
| Eastern Europeans | 100.0 /100 | #18 | Exceptional $114,523 |
| Burmese | 100.0 /100 | #19 | Exceptional $113,701 |
| Immigrants | Korea | 100.0 /100 | #20 | Exceptional $113,401 |
| Asians | 100.0 /100 | #21 | Exceptional $112,666 |
| Immigrants | Belgium | 100.0 /100 | #22 | Exceptional $112,575 |
| Immigrants | Japan | 100.0 /100 | #23 | Exceptional $112,228 |
| Immigrants | Sweden | 100.0 /100 | #24 | Exceptional $112,010 |
| Immigrants | Northern Europe | 100.0 /100 | #25 | Exceptional $111,676 |