Immigrants vs Immigrants from Ireland Householder Income Ages 25 - 44 years
COMPARE
Immigrants
Immigrants from Ireland
Householder Income Ages 25 - 44 years
Householder Income Ages 25 - 44 years Comparison
Immigrants
Immigrants from Ireland
$94,423
HOUSEHOLDER INCOME AGES 25 - 44 YEARS
48.0/ 100
METRIC RATING
176th/ 347
METRIC RANK
$120,333
HOUSEHOLDER INCOME AGES 25 - 44 YEARS
100.0/ 100
METRIC RATING
7th/ 347
METRIC RANK
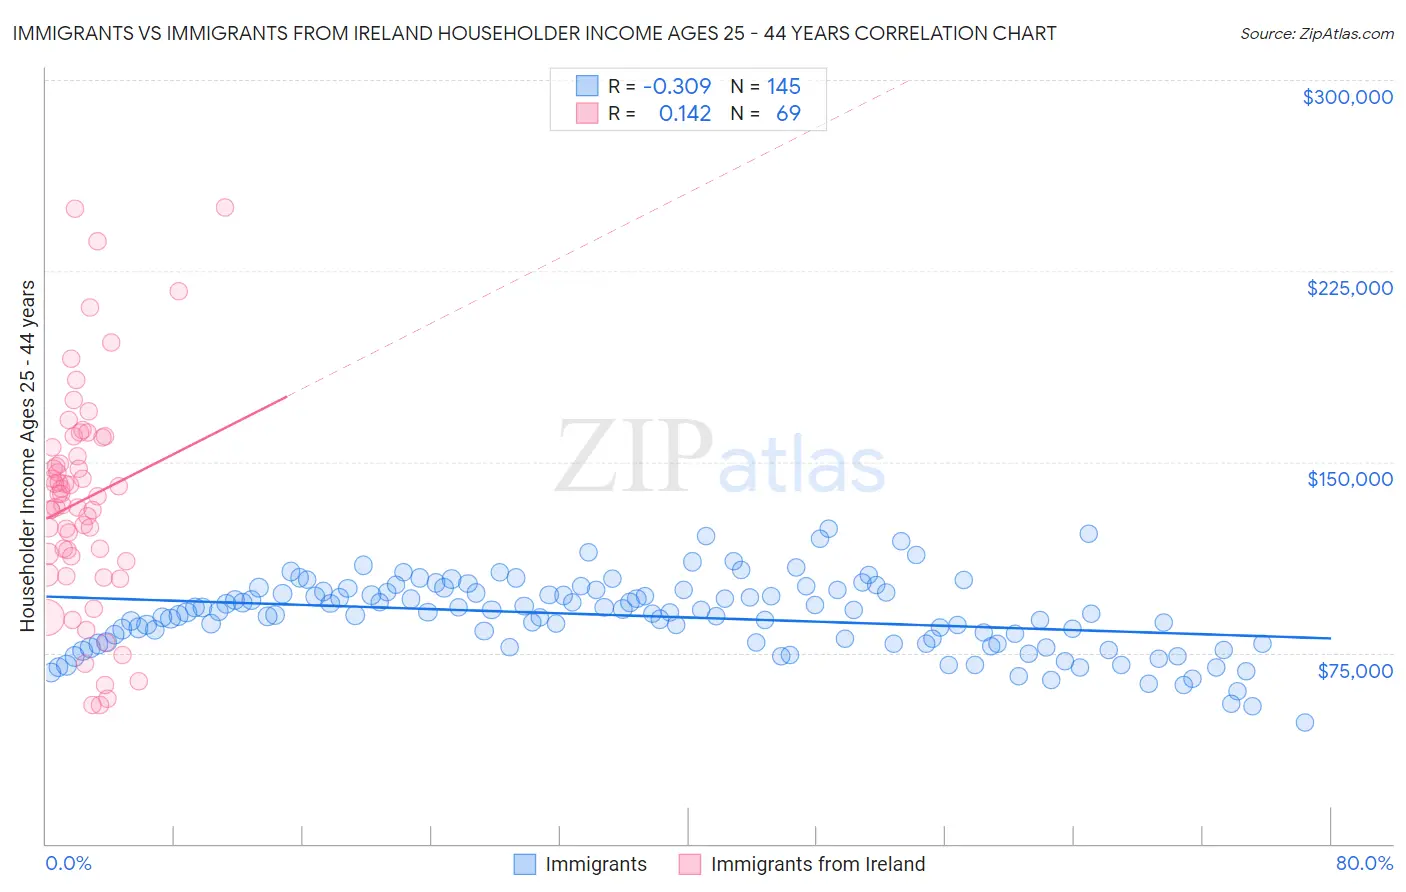
Immigrants vs Immigrants from Ireland Householder Income Ages 25 - 44 years Correlation Chart
The statistical analysis conducted on geographies consisting of 570,849,729 people shows a mild negative correlation between the proportion of Immigrants and household income with householder between the ages 25 and 44 in the United States with a correlation coefficient (R) of -0.309 and weighted average of $94,423. Similarly, the statistical analysis conducted on geographies consisting of 240,342,740 people shows a poor positive correlation between the proportion of Immigrants from Ireland and household income with householder between the ages 25 and 44 in the United States with a correlation coefficient (R) of 0.142 and weighted average of $120,333, a difference of 27.4%.
Householder Income Ages 25 - 44 years Correlation Summary
| Measurement | Immigrants | Immigrants from Ireland |
| Minimum | $47,510 | $54,479 |
| Maximum | $123,721 | $250,001 |
| Range | $76,211 | $195,522 |
| Mean | $89,554 | $134,959 |
| Median | $91,017 | $136,656 |
| Interquartile 25% (IQ1) | $78,698 | $112,137 |
| Interquartile 75% (IQ3) | $99,239 | $157,677 |
| Interquartile Range (IQR) | $20,541 | $45,540 |
| Standard Deviation (Sample) | $14,494 | $42,676 |
| Standard Deviation (Population) | $14,444 | $42,366 |
Similar Demographics by Householder Income Ages 25 - 44 years
Demographics Similar to Immigrants by Householder Income Ages 25 - 44 years
In terms of householder income ages 25 - 44 years, the demographic groups most similar to Immigrants are English ($94,429, a difference of 0.010%), Colombian ($94,565, a difference of 0.15%), Belgian ($94,262, a difference of 0.17%), Finnish ($94,610, a difference of 0.20%), and Scottish ($94,622, a difference of 0.21%).
| Demographics | Rating | Rank | Householder Income Ages 25 - 44 years |
| Native Hawaiians | 56.8 /100 | #169 | Average $95,058 |
| Slovaks | 56.4 /100 | #170 | Average $95,032 |
| Immigrants | Armenia | 54.2 /100 | #171 | Average $94,867 |
| Scottish | 50.8 /100 | #172 | Average $94,622 |
| Finns | 50.6 /100 | #173 | Average $94,610 |
| Colombians | 50.0 /100 | #174 | Average $94,565 |
| English | 48.1 /100 | #175 | Average $94,429 |
| Immigrants | Immigrants | 48.0 /100 | #176 | Average $94,423 |
| Belgians | 45.8 /100 | #177 | Average $94,262 |
| Immigrants | South America | 42.8 /100 | #178 | Average $94,042 |
| French Canadians | 38.2 /100 | #179 | Fair $93,694 |
| French | 37.8 /100 | #180 | Fair $93,665 |
| Puget Sound Salish | 37.7 /100 | #181 | Fair $93,661 |
| Uruguayans | 37.3 /100 | #182 | Fair $93,631 |
| Guamanians/Chamorros | 36.5 /100 | #183 | Fair $93,569 |
Demographics Similar to Immigrants from Ireland by Householder Income Ages 25 - 44 years
In terms of householder income ages 25 - 44 years, the demographic groups most similar to Immigrants from Ireland are Iranian ($120,292, a difference of 0.030%), Immigrants from China ($119,756, a difference of 0.48%), Indian (Asian) ($119,496, a difference of 0.70%), Okinawan ($119,349, a difference of 0.82%), and Immigrants from Iran ($119,204, a difference of 0.95%).
| Demographics | Rating | Rank | Householder Income Ages 25 - 44 years |
| Immigrants | Taiwan | 100.0 /100 | #1 | Exceptional $129,122 |
| Filipinos | 100.0 /100 | #2 | Exceptional $128,723 |
| Immigrants | Hong Kong | 100.0 /100 | #3 | Exceptional $128,140 |
| Immigrants | Singapore | 100.0 /100 | #4 | Exceptional $124,429 |
| Immigrants | India | 100.0 /100 | #5 | Exceptional $124,238 |
| Thais | 100.0 /100 | #6 | Exceptional $121,778 |
| Immigrants | Ireland | 100.0 /100 | #7 | Exceptional $120,333 |
| Iranians | 100.0 /100 | #8 | Exceptional $120,292 |
| Immigrants | China | 100.0 /100 | #9 | Exceptional $119,756 |
| Indians (Asian) | 100.0 /100 | #10 | Exceptional $119,496 |
| Okinawans | 100.0 /100 | #11 | Exceptional $119,349 |
| Immigrants | Iran | 100.0 /100 | #12 | Exceptional $119,204 |
| Immigrants | Eastern Asia | 100.0 /100 | #13 | Exceptional $118,056 |
| Immigrants | Israel | 100.0 /100 | #14 | Exceptional $117,219 |
| Immigrants | South Central Asia | 100.0 /100 | #15 | Exceptional $116,626 |