Israeli vs Cree Householder Income Over 65 years
COMPARE
Israeli
Cree
Householder Income Over 65 years
Householder Income Over 65 years Comparison
Israelis
Cree
$66,636
HOUSEHOLDER INCOME OVER 65 YEARS
99.7/ 100
METRIC RATING
51st/ 347
METRIC RANK
$54,129
HOUSEHOLDER INCOME OVER 65 YEARS
0.1/ 100
METRIC RATING
276th/ 347
METRIC RANK
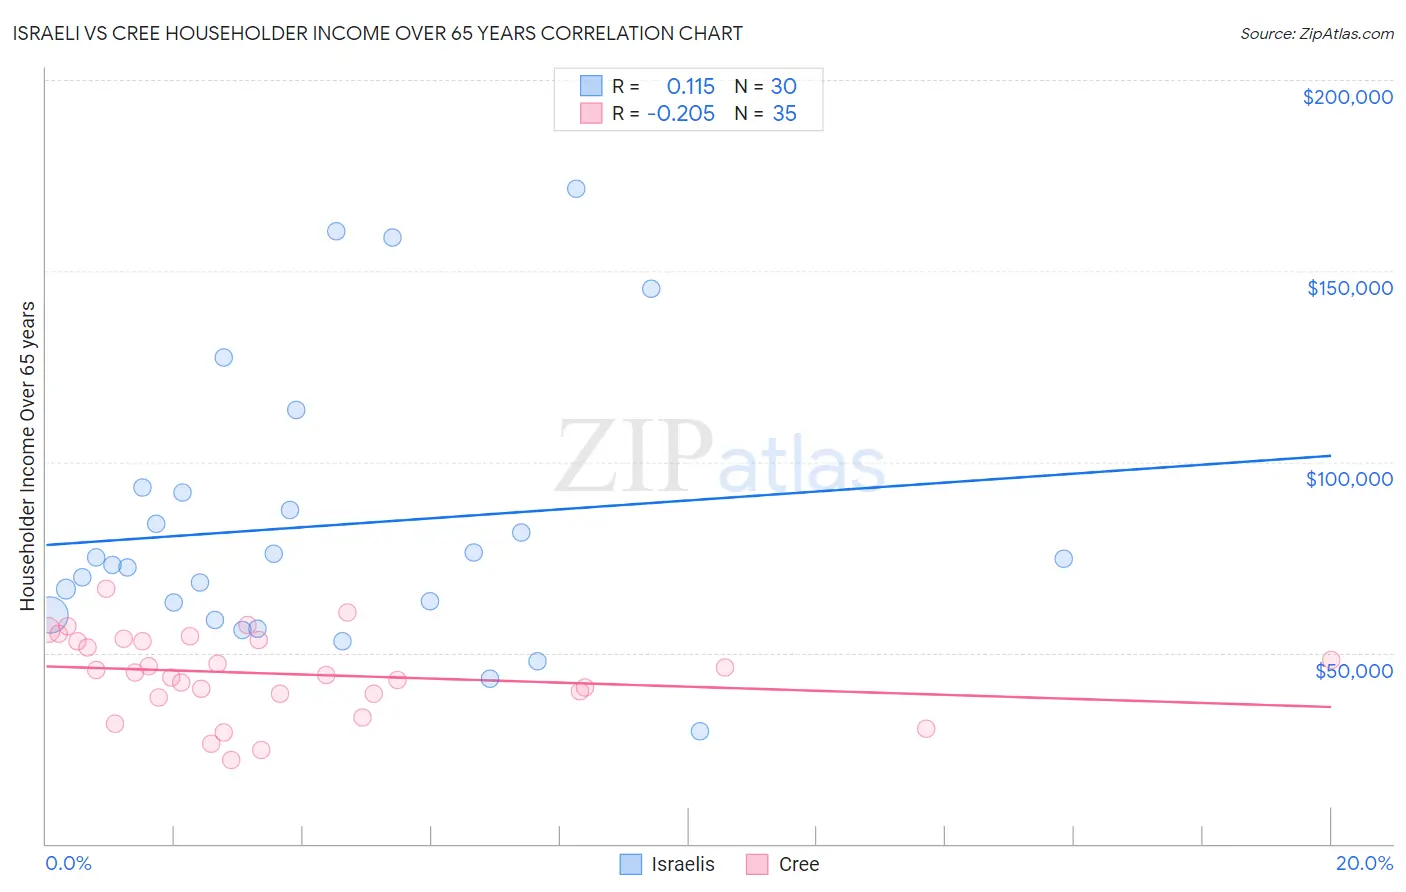
Israeli vs Cree Householder Income Over 65 years Correlation Chart
The statistical analysis conducted on geographies consisting of 210,595,359 people shows a poor positive correlation between the proportion of Israelis and household income with householder over the age of 65 in the United States with a correlation coefficient (R) of 0.115 and weighted average of $66,636. Similarly, the statistical analysis conducted on geographies consisting of 76,146,635 people shows a weak negative correlation between the proportion of Cree and household income with householder over the age of 65 in the United States with a correlation coefficient (R) of -0.205 and weighted average of $54,129, a difference of 23.1%.
Householder Income Over 65 years Correlation Summary
| Measurement | Israeli | Cree |
| Minimum | $29,457 | $21,771 |
| Maximum | $171,563 | $66,667 |
| Range | $142,106 | $44,896 |
| Mean | $83,272 | $44,467 |
| Median | $73,731 | $44,834 |
| Interquartile 25% (IQ1) | $59,859 | $39,228 |
| Interquartile 75% (IQ3) | $92,033 | $53,517 |
| Interquartile Range (IQR) | $32,174 | $14,289 |
| Standard Deviation (Sample) | $36,038 | $10,767 |
| Standard Deviation (Population) | $35,432 | $10,613 |
Similar Demographics by Householder Income Over 65 years
Demographics Similar to Israelis by Householder Income Over 65 years
In terms of householder income over 65 years, the demographic groups most similar to Israelis are Immigrants from Scotland ($66,620, a difference of 0.020%), Immigrants from Pakistan ($66,617, a difference of 0.030%), Immigrants from Turkey ($66,672, a difference of 0.050%), Immigrants from Indonesia ($66,694, a difference of 0.090%), and Immigrants from Netherlands ($66,463, a difference of 0.26%).
| Demographics | Rating | Rank | Householder Income Over 65 years |
| Immigrants | South Africa | 99.9 /100 | #44 | Exceptional $67,234 |
| Immigrants | Afghanistan | 99.8 /100 | #45 | Exceptional $67,007 |
| Cambodians | 99.8 /100 | #46 | Exceptional $66,892 |
| Australians | 99.8 /100 | #47 | Exceptional $66,891 |
| Immigrants | France | 99.8 /100 | #48 | Exceptional $66,826 |
| Immigrants | Indonesia | 99.8 /100 | #49 | Exceptional $66,694 |
| Immigrants | Turkey | 99.7 /100 | #50 | Exceptional $66,672 |
| Israelis | 99.7 /100 | #51 | Exceptional $66,636 |
| Immigrants | Scotland | 99.7 /100 | #52 | Exceptional $66,620 |
| Immigrants | Pakistan | 99.7 /100 | #53 | Exceptional $66,617 |
| Immigrants | Netherlands | 99.7 /100 | #54 | Exceptional $66,463 |
| Immigrants | Czechoslovakia | 99.7 /100 | #55 | Exceptional $66,376 |
| Laotians | 99.6 /100 | #56 | Exceptional $66,306 |
| Bulgarians | 99.6 /100 | #57 | Exceptional $66,236 |
| Immigrants | Philippines | 99.6 /100 | #58 | Exceptional $66,161 |
Demographics Similar to Cree by Householder Income Over 65 years
In terms of householder income over 65 years, the demographic groups most similar to Cree are Cherokee ($54,133, a difference of 0.010%), Barbadian ($54,163, a difference of 0.060%), Cheyenne ($54,096, a difference of 0.060%), Indonesian ($54,176, a difference of 0.090%), and Potawatomi ($54,212, a difference of 0.15%).
| Demographics | Rating | Rank | Householder Income Over 65 years |
| Nicaraguans | 0.1 /100 | #269 | Tragic $54,474 |
| Immigrants | Senegal | 0.1 /100 | #270 | Tragic $54,447 |
| Liberians | 0.1 /100 | #271 | Tragic $54,356 |
| Potawatomi | 0.1 /100 | #272 | Tragic $54,212 |
| Indonesians | 0.1 /100 | #273 | Tragic $54,176 |
| Barbadians | 0.1 /100 | #274 | Tragic $54,163 |
| Cherokee | 0.1 /100 | #275 | Tragic $54,133 |
| Cree | 0.1 /100 | #276 | Tragic $54,129 |
| Cheyenne | 0.1 /100 | #277 | Tragic $54,096 |
| Immigrants | Ecuador | 0.1 /100 | #278 | Tragic $54,030 |
| Blackfeet | 0.1 /100 | #279 | Tragic $54,029 |
| Immigrants | Jamaica | 0.1 /100 | #280 | Tragic $54,027 |
| Somalis | 0.1 /100 | #281 | Tragic $54,004 |
| Immigrants | Armenia | 0.1 /100 | #282 | Tragic $53,974 |
| Immigrants | Liberia | 0.1 /100 | #283 | Tragic $53,967 |