Italian vs German Per Capita Income
COMPARE
Italian
German
Per Capita Income
Per Capita Income Comparison
Italians
Germans
$47,574
PER CAPITA INCOME
98.8/ 100
METRIC RATING
90th/ 347
METRIC RANK
$43,067
PER CAPITA INCOME
33.9/ 100
METRIC RATING
183rd/ 347
METRIC RANK
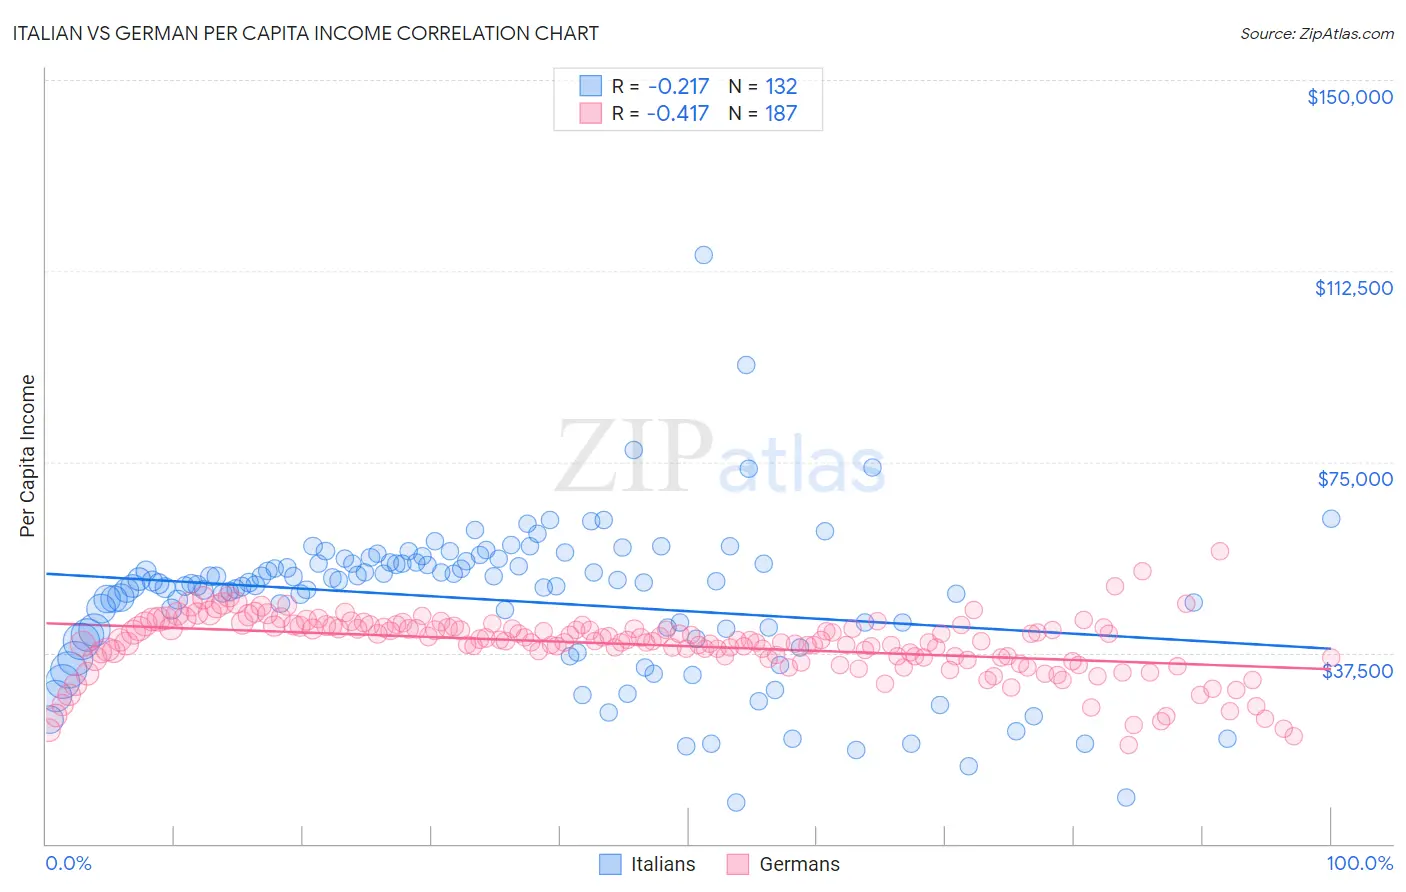
Italian vs German Per Capita Income Correlation Chart
The statistical analysis conducted on geographies consisting of 575,176,397 people shows a weak negative correlation between the proportion of Italians and per capita income in the United States with a correlation coefficient (R) of -0.217 and weighted average of $47,574. Similarly, the statistical analysis conducted on geographies consisting of 581,359,924 people shows a moderate negative correlation between the proportion of Germans and per capita income in the United States with a correlation coefficient (R) of -0.417 and weighted average of $43,067, a difference of 10.5%.
Per Capita Income Correlation Summary
| Measurement | Italian | German |
| Minimum | $7,984 | $19,415 |
| Maximum | $115,662 | $57,467 |
| Range | $107,678 | $38,052 |
| Mean | $47,928 | $39,066 |
| Median | $51,120 | $39,927 |
| Interquartile 25% (IQ1) | $41,399 | $36,606 |
| Interquartile 75% (IQ3) | $55,329 | $42,630 |
| Interquartile Range (IQR) | $13,930 | $6,024 |
| Standard Deviation (Sample) | $15,071 | $5,932 |
| Standard Deviation (Population) | $15,014 | $5,916 |
Similar Demographics by Per Capita Income
Demographics Similar to Italians by Per Capita Income
In terms of per capita income, the demographic groups most similar to Italians are Macedonian ($47,573, a difference of 0.0%), Immigrants from Moldova ($47,489, a difference of 0.18%), Northern European ($47,698, a difference of 0.26%), Croatian ($47,742, a difference of 0.35%), and Immigrants from Zimbabwe ($47,394, a difference of 0.38%).
| Demographics | Rating | Rank | Per Capita Income |
| Immigrants | Brazil | 99.4 /100 | #83 | Exceptional $48,164 |
| Immigrants | Ukraine | 99.3 /100 | #84 | Exceptional $48,134 |
| Austrians | 99.3 /100 | #85 | Exceptional $48,116 |
| Immigrants | Southern Europe | 99.3 /100 | #86 | Exceptional $48,027 |
| Ukrainians | 99.3 /100 | #87 | Exceptional $48,014 |
| Croatians | 99.0 /100 | #88 | Exceptional $47,742 |
| Northern Europeans | 98.9 /100 | #89 | Exceptional $47,698 |
| Italians | 98.8 /100 | #90 | Exceptional $47,574 |
| Macedonians | 98.8 /100 | #91 | Exceptional $47,573 |
| Immigrants | Moldova | 98.7 /100 | #92 | Exceptional $47,489 |
| Immigrants | Zimbabwe | 98.5 /100 | #93 | Exceptional $47,394 |
| Albanians | 98.5 /100 | #94 | Exceptional $47,379 |
| Immigrants | Egypt | 98.5 /100 | #95 | Exceptional $47,361 |
| Alsatians | 98.3 /100 | #96 | Exceptional $47,284 |
| Carpatho Rusyns | 98.2 /100 | #97 | Exceptional $47,248 |
Demographics Similar to Germans by Per Capita Income
In terms of per capita income, the demographic groups most similar to Germans are Spaniard ($43,028, a difference of 0.090%), Immigrants ($43,010, a difference of 0.13%), French Canadian ($43,003, a difference of 0.15%), Immigrants from Colombia ($42,971, a difference of 0.22%), and Immigrants from Africa ($42,950, a difference of 0.27%).
| Demographics | Rating | Rank | Per Capita Income |
| Immigrants | South Eastern Asia | 46.6 /100 | #176 | Average $43,539 |
| Tlingit-Haida | 45.9 /100 | #177 | Average $43,516 |
| Immigrants | Costa Rica | 44.5 /100 | #178 | Average $43,464 |
| Finns | 44.4 /100 | #179 | Average $43,461 |
| Sierra Leoneans | 42.9 /100 | #180 | Average $43,405 |
| Welsh | 38.2 /100 | #181 | Fair $43,233 |
| Immigrants | Vietnam | 38.1 /100 | #182 | Fair $43,229 |
| Germans | 33.9 /100 | #183 | Fair $43,067 |
| Spaniards | 32.9 /100 | #184 | Fair $43,028 |
| Immigrants | Immigrants | 32.5 /100 | #185 | Fair $43,010 |
| French Canadians | 32.3 /100 | #186 | Fair $43,003 |
| Immigrants | Colombia | 31.5 /100 | #187 | Fair $42,971 |
| Immigrants | Africa | 31.0 /100 | #188 | Fair $42,950 |
| Bermudans | 30.1 /100 | #189 | Fair $42,911 |
| Kenyans | 27.7 /100 | #190 | Fair $42,808 |