Immigrants from Israel vs German Per Capita Income
COMPARE
Immigrants from Israel
German
Per Capita Income
Per Capita Income Comparison
Immigrants from Israel
Germans
$57,384
PER CAPITA INCOME
100.0/ 100
METRIC RATING
7th/ 347
METRIC RANK
$43,067
PER CAPITA INCOME
33.9/ 100
METRIC RATING
183rd/ 347
METRIC RANK
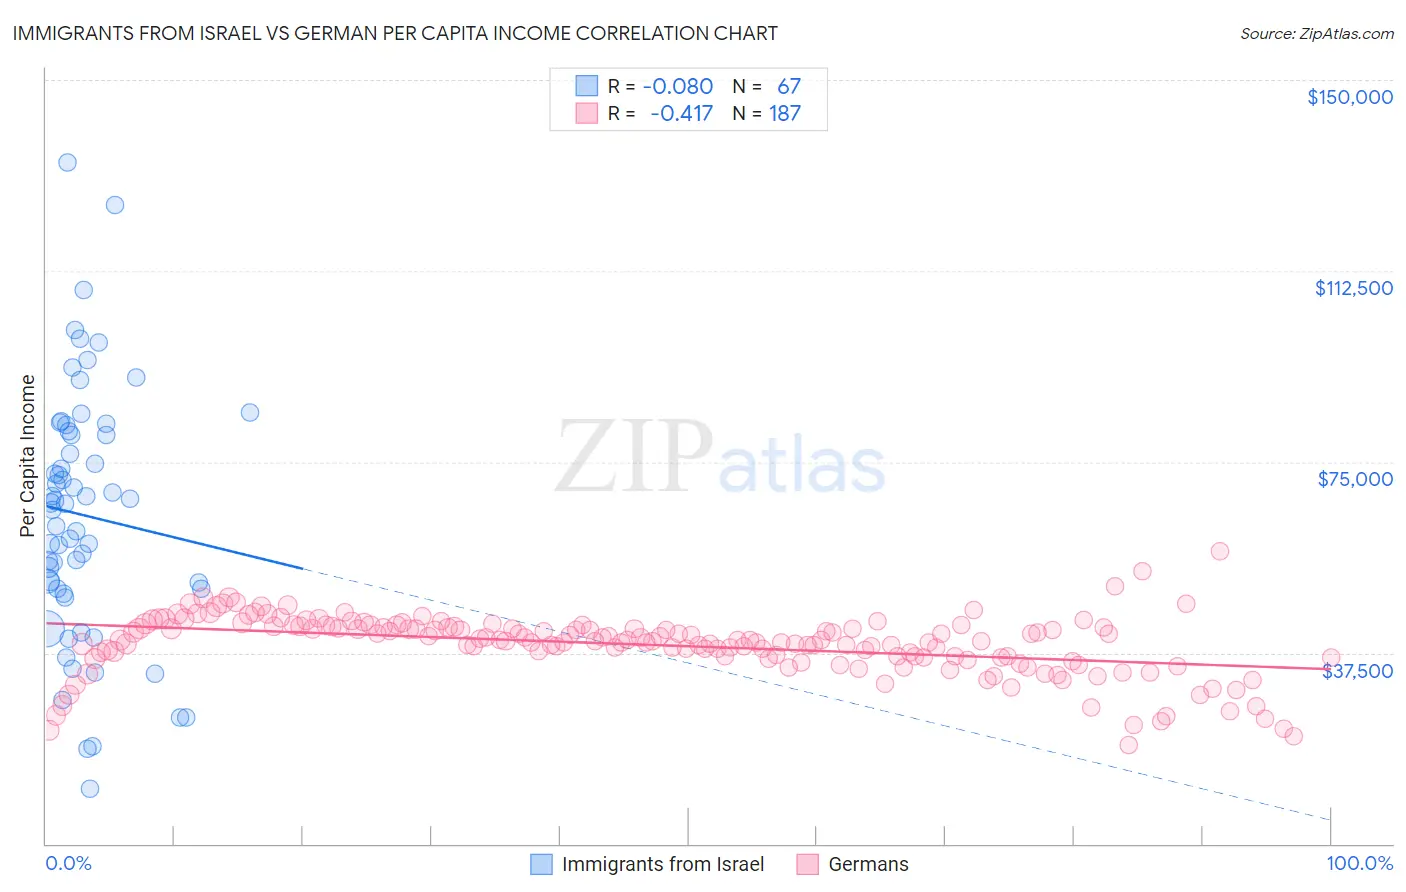
Immigrants from Israel vs German Per Capita Income Correlation Chart
The statistical analysis conducted on geographies consisting of 210,034,998 people shows a slight negative correlation between the proportion of Immigrants from Israel and per capita income in the United States with a correlation coefficient (R) of -0.080 and weighted average of $57,384. Similarly, the statistical analysis conducted on geographies consisting of 581,359,924 people shows a moderate negative correlation between the proportion of Germans and per capita income in the United States with a correlation coefficient (R) of -0.417 and weighted average of $43,067, a difference of 33.2%.
Per Capita Income Correlation Summary
| Measurement | Immigrants from Israel | German |
| Minimum | $10,922 | $19,415 |
| Maximum | $133,703 | $57,467 |
| Range | $122,781 | $38,052 |
| Mean | $64,480 | $39,066 |
| Median | $66,721 | $39,927 |
| Interquartile 25% (IQ1) | $50,016 | $36,606 |
| Interquartile 75% (IQ3) | $80,903 | $42,630 |
| Interquartile Range (IQR) | $30,888 | $6,024 |
| Standard Deviation (Sample) | $24,657 | $5,932 |
| Standard Deviation (Population) | $24,473 | $5,916 |
Similar Demographics by Per Capita Income
Demographics Similar to Immigrants from Israel by Per Capita Income
In terms of per capita income, the demographic groups most similar to Immigrants from Israel are Immigrants from Taiwan ($57,742, a difference of 0.62%), Immigrants from Iran ($57,759, a difference of 0.65%), Immigrants from Australia ($57,953, a difference of 0.99%), Immigrants from Hong Kong ($56,709, a difference of 1.2%), and Immigrants from Ireland ($56,584, a difference of 1.4%).
| Demographics | Rating | Rank | Per Capita Income |
| Filipinos | 100.0 /100 | #1 | Exceptional $59,066 |
| Iranians | 100.0 /100 | #2 | Exceptional $58,786 |
| Immigrants | Singapore | 100.0 /100 | #3 | Exceptional $58,353 |
| Immigrants | Australia | 100.0 /100 | #4 | Exceptional $57,953 |
| Immigrants | Iran | 100.0 /100 | #5 | Exceptional $57,759 |
| Immigrants | Taiwan | 100.0 /100 | #6 | Exceptional $57,742 |
| Immigrants | Israel | 100.0 /100 | #7 | Exceptional $57,384 |
| Immigrants | Hong Kong | 100.0 /100 | #8 | Exceptional $56,709 |
| Immigrants | Ireland | 100.0 /100 | #9 | Exceptional $56,584 |
| Okinawans | 100.0 /100 | #10 | Exceptional $55,817 |
| Eastern Europeans | 100.0 /100 | #11 | Exceptional $55,780 |
| Immigrants | Sweden | 100.0 /100 | #12 | Exceptional $55,582 |
| Immigrants | India | 100.0 /100 | #13 | Exceptional $55,268 |
| Immigrants | Belgium | 100.0 /100 | #14 | Exceptional $55,082 |
| Cypriots | 100.0 /100 | #15 | Exceptional $54,899 |
Demographics Similar to Germans by Per Capita Income
In terms of per capita income, the demographic groups most similar to Germans are Spaniard ($43,028, a difference of 0.090%), Immigrants ($43,010, a difference of 0.13%), French Canadian ($43,003, a difference of 0.15%), Immigrants from Colombia ($42,971, a difference of 0.22%), and Immigrants from Africa ($42,950, a difference of 0.27%).
| Demographics | Rating | Rank | Per Capita Income |
| Immigrants | South Eastern Asia | 46.6 /100 | #176 | Average $43,539 |
| Tlingit-Haida | 45.9 /100 | #177 | Average $43,516 |
| Immigrants | Costa Rica | 44.5 /100 | #178 | Average $43,464 |
| Finns | 44.4 /100 | #179 | Average $43,461 |
| Sierra Leoneans | 42.9 /100 | #180 | Average $43,405 |
| Welsh | 38.2 /100 | #181 | Fair $43,233 |
| Immigrants | Vietnam | 38.1 /100 | #182 | Fair $43,229 |
| Germans | 33.9 /100 | #183 | Fair $43,067 |
| Spaniards | 32.9 /100 | #184 | Fair $43,028 |
| Immigrants | Immigrants | 32.5 /100 | #185 | Fair $43,010 |
| French Canadians | 32.3 /100 | #186 | Fair $43,003 |
| Immigrants | Colombia | 31.5 /100 | #187 | Fair $42,971 |
| Immigrants | Africa | 31.0 /100 | #188 | Fair $42,950 |
| Bermudans | 30.1 /100 | #189 | Fair $42,911 |
| Kenyans | 27.7 /100 | #190 | Fair $42,808 |