Immigrants from Sri Lanka vs German Per Capita Income
COMPARE
Immigrants from Sri Lanka
German
Per Capita Income
Per Capita Income Comparison
Immigrants from Sri Lanka
Germans
$50,555
PER CAPITA INCOME
100.0/ 100
METRIC RATING
50th/ 347
METRIC RANK
$43,067
PER CAPITA INCOME
33.9/ 100
METRIC RATING
183rd/ 347
METRIC RANK
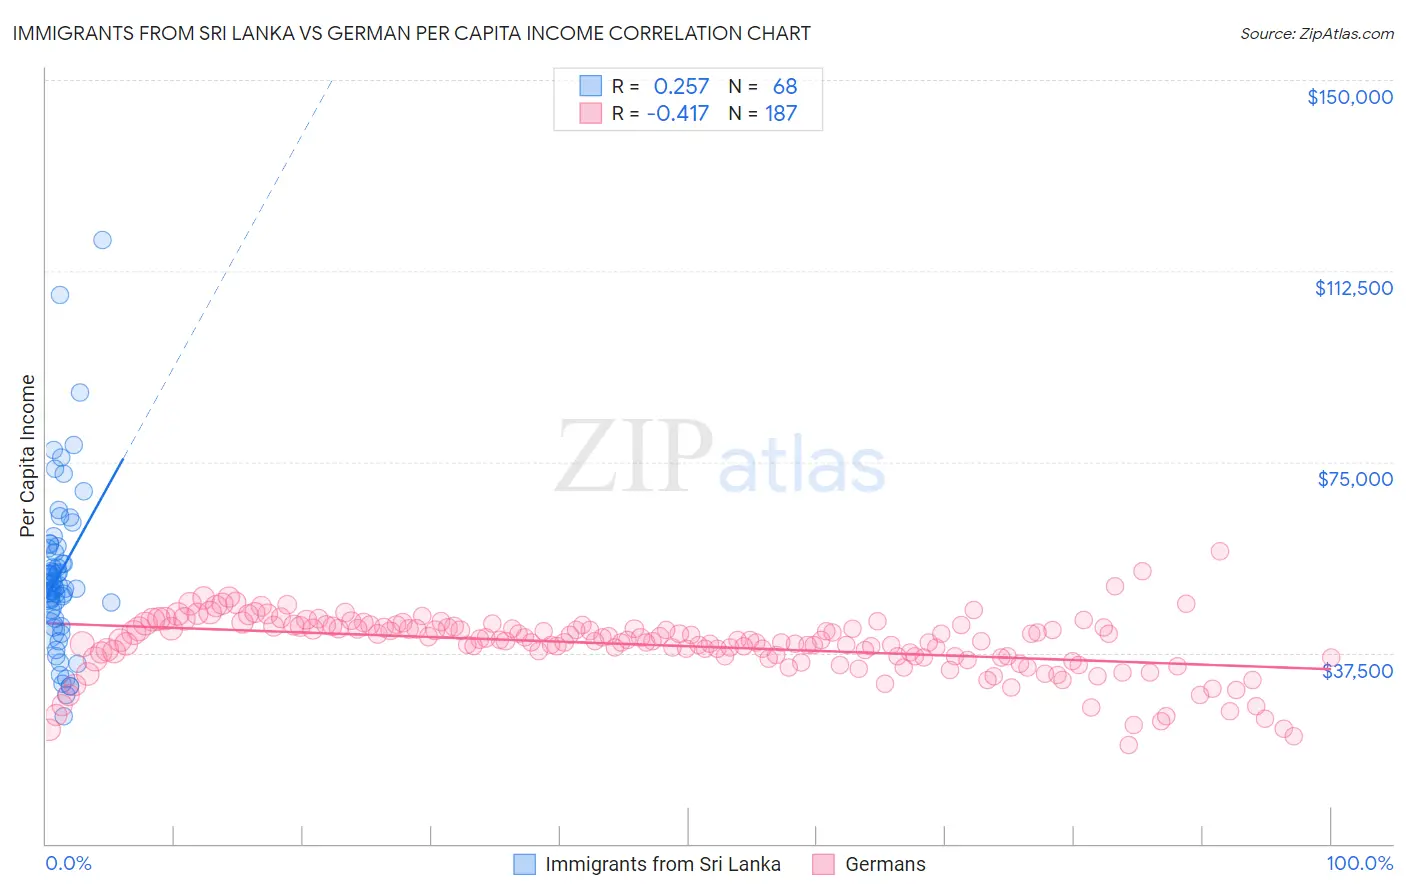
Immigrants from Sri Lanka vs German Per Capita Income Correlation Chart
The statistical analysis conducted on geographies consisting of 149,699,244 people shows a weak positive correlation between the proportion of Immigrants from Sri Lanka and per capita income in the United States with a correlation coefficient (R) of 0.257 and weighted average of $50,555. Similarly, the statistical analysis conducted on geographies consisting of 581,359,924 people shows a moderate negative correlation between the proportion of Germans and per capita income in the United States with a correlation coefficient (R) of -0.417 and weighted average of $43,067, a difference of 17.4%.
Per Capita Income Correlation Summary
| Measurement | Immigrants from Sri Lanka | German |
| Minimum | $24,946 | $19,415 |
| Maximum | $118,591 | $57,467 |
| Range | $93,645 | $38,052 |
| Mean | $53,052 | $39,066 |
| Median | $50,889 | $39,927 |
| Interquartile 25% (IQ1) | $45,023 | $36,606 |
| Interquartile 75% (IQ3) | $58,187 | $42,630 |
| Interquartile Range (IQR) | $13,164 | $6,024 |
| Standard Deviation (Sample) | $16,356 | $5,932 |
| Standard Deviation (Population) | $16,236 | $5,916 |
Similar Demographics by Per Capita Income
Demographics Similar to Immigrants from Sri Lanka by Per Capita Income
In terms of per capita income, the demographic groups most similar to Immigrants from Sri Lanka are New Zealander ($50,575, a difference of 0.040%), Immigrants from Netherlands ($50,458, a difference of 0.19%), Immigrants from Croatia ($50,417, a difference of 0.27%), Paraguayan ($50,385, a difference of 0.34%), and Immigrants from Serbia ($50,810, a difference of 0.50%).
| Demographics | Rating | Rank | Per Capita Income |
| Immigrants | Lithuania | 100.0 /100 | #43 | Exceptional $51,361 |
| Immigrants | Europe | 100.0 /100 | #44 | Exceptional $50,950 |
| Immigrants | Spain | 100.0 /100 | #45 | Exceptional $50,933 |
| Immigrants | Latvia | 100.0 /100 | #46 | Exceptional $50,914 |
| Bulgarians | 100.0 /100 | #47 | Exceptional $50,906 |
| Immigrants | Serbia | 100.0 /100 | #48 | Exceptional $50,810 |
| New Zealanders | 100.0 /100 | #49 | Exceptional $50,575 |
| Immigrants | Sri Lanka | 100.0 /100 | #50 | Exceptional $50,555 |
| Immigrants | Netherlands | 100.0 /100 | #51 | Exceptional $50,458 |
| Immigrants | Croatia | 99.9 /100 | #52 | Exceptional $50,417 |
| Paraguayans | 99.9 /100 | #53 | Exceptional $50,385 |
| Immigrants | Belarus | 99.9 /100 | #54 | Exceptional $50,303 |
| Immigrants | Western Europe | 99.9 /100 | #55 | Exceptional $50,065 |
| Asians | 99.9 /100 | #56 | Exceptional $50,057 |
| South Africans | 99.9 /100 | #57 | Exceptional $50,044 |
Demographics Similar to Germans by Per Capita Income
In terms of per capita income, the demographic groups most similar to Germans are Spaniard ($43,028, a difference of 0.090%), Immigrants ($43,010, a difference of 0.13%), French Canadian ($43,003, a difference of 0.15%), Immigrants from Colombia ($42,971, a difference of 0.22%), and Immigrants from Africa ($42,950, a difference of 0.27%).
| Demographics | Rating | Rank | Per Capita Income |
| Immigrants | South Eastern Asia | 46.6 /100 | #176 | Average $43,539 |
| Tlingit-Haida | 45.9 /100 | #177 | Average $43,516 |
| Immigrants | Costa Rica | 44.5 /100 | #178 | Average $43,464 |
| Finns | 44.4 /100 | #179 | Average $43,461 |
| Sierra Leoneans | 42.9 /100 | #180 | Average $43,405 |
| Welsh | 38.2 /100 | #181 | Fair $43,233 |
| Immigrants | Vietnam | 38.1 /100 | #182 | Fair $43,229 |
| Germans | 33.9 /100 | #183 | Fair $43,067 |
| Spaniards | 32.9 /100 | #184 | Fair $43,028 |
| Immigrants | Immigrants | 32.5 /100 | #185 | Fair $43,010 |
| French Canadians | 32.3 /100 | #186 | Fair $43,003 |
| Immigrants | Colombia | 31.5 /100 | #187 | Fair $42,971 |
| Immigrants | Africa | 31.0 /100 | #188 | Fair $42,950 |
| Bermudans | 30.1 /100 | #189 | Fair $42,911 |
| Kenyans | 27.7 /100 | #190 | Fair $42,808 |