Italian vs Immigrants from Cambodia Per Capita Income
COMPARE
Italian
Immigrants from Cambodia
Per Capita Income
Per Capita Income Comparison
Italians
Immigrants from Cambodia
$47,574
PER CAPITA INCOME
98.8/ 100
METRIC RATING
90th/ 347
METRIC RANK
$40,434
PER CAPITA INCOME
2.6/ 100
METRIC RATING
237th/ 347
METRIC RANK
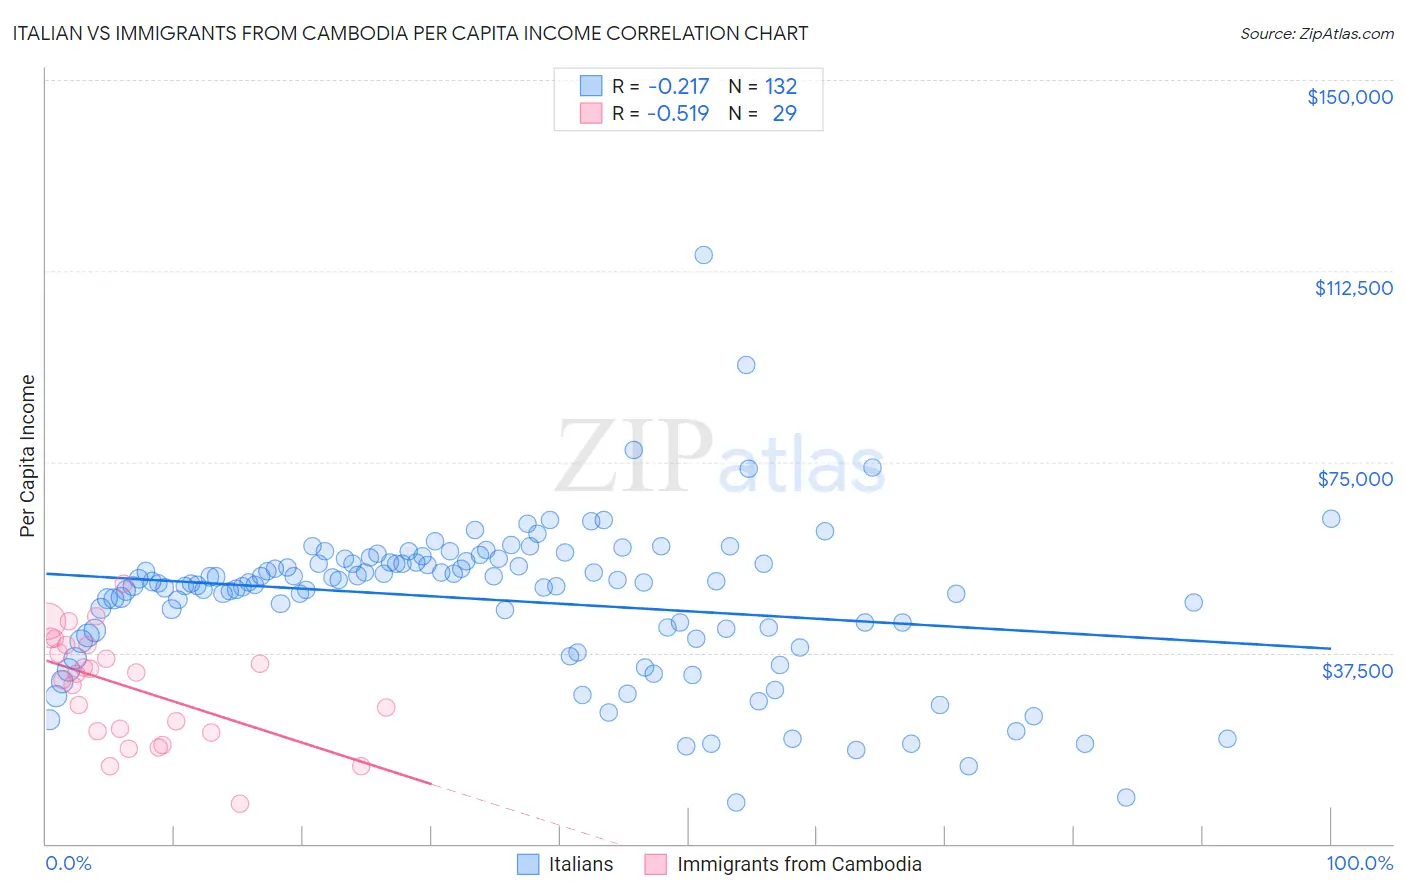
Italian vs Immigrants from Cambodia Per Capita Income Correlation Chart
The statistical analysis conducted on geographies consisting of 575,176,397 people shows a weak negative correlation between the proportion of Italians and per capita income in the United States with a correlation coefficient (R) of -0.217 and weighted average of $47,574. Similarly, the statistical analysis conducted on geographies consisting of 205,159,034 people shows a substantial negative correlation between the proportion of Immigrants from Cambodia and per capita income in the United States with a correlation coefficient (R) of -0.519 and weighted average of $40,434, a difference of 17.7%.
Per Capita Income Correlation Summary
| Measurement | Italian | Immigrants from Cambodia |
| Minimum | $7,984 | $7,849 |
| Maximum | $115,662 | $51,157 |
| Range | $107,678 | $43,308 |
| Mean | $47,928 | $30,701 |
| Median | $51,120 | $33,314 |
| Interquartile 25% (IQ1) | $41,399 | $21,996 |
| Interquartile 75% (IQ3) | $55,329 | $39,085 |
| Interquartile Range (IQR) | $13,930 | $17,089 |
| Standard Deviation (Sample) | $15,071 | $10,577 |
| Standard Deviation (Population) | $15,014 | $10,393 |
Similar Demographics by Per Capita Income
Demographics Similar to Italians by Per Capita Income
In terms of per capita income, the demographic groups most similar to Italians are Macedonian ($47,573, a difference of 0.0%), Immigrants from Moldova ($47,489, a difference of 0.18%), Northern European ($47,698, a difference of 0.26%), Croatian ($47,742, a difference of 0.35%), and Immigrants from Zimbabwe ($47,394, a difference of 0.38%).
| Demographics | Rating | Rank | Per Capita Income |
| Immigrants | Brazil | 99.4 /100 | #83 | Exceptional $48,164 |
| Immigrants | Ukraine | 99.3 /100 | #84 | Exceptional $48,134 |
| Austrians | 99.3 /100 | #85 | Exceptional $48,116 |
| Immigrants | Southern Europe | 99.3 /100 | #86 | Exceptional $48,027 |
| Ukrainians | 99.3 /100 | #87 | Exceptional $48,014 |
| Croatians | 99.0 /100 | #88 | Exceptional $47,742 |
| Northern Europeans | 98.9 /100 | #89 | Exceptional $47,698 |
| Italians | 98.8 /100 | #90 | Exceptional $47,574 |
| Macedonians | 98.8 /100 | #91 | Exceptional $47,573 |
| Immigrants | Moldova | 98.7 /100 | #92 | Exceptional $47,489 |
| Immigrants | Zimbabwe | 98.5 /100 | #93 | Exceptional $47,394 |
| Albanians | 98.5 /100 | #94 | Exceptional $47,379 |
| Immigrants | Egypt | 98.5 /100 | #95 | Exceptional $47,361 |
| Alsatians | 98.3 /100 | #96 | Exceptional $47,284 |
| Carpatho Rusyns | 98.2 /100 | #97 | Exceptional $47,248 |
Demographics Similar to Immigrants from Cambodia by Per Capita Income
In terms of per capita income, the demographic groups most similar to Immigrants from Cambodia are Somali ($40,367, a difference of 0.16%), Tsimshian ($40,344, a difference of 0.22%), Immigrants from Nigeria ($40,339, a difference of 0.24%), British West Indian ($40,330, a difference of 0.26%), and Immigrants from Western Africa ($40,294, a difference of 0.35%).
| Demographics | Rating | Rank | Per Capita Income |
| Native Hawaiians | 4.9 /100 | #230 | Tragic $41,017 |
| Senegalese | 4.8 /100 | #231 | Tragic $41,000 |
| Guyanese | 4.5 /100 | #232 | Tragic $40,949 |
| Delaware | 3.8 /100 | #233 | Tragic $40,778 |
| Immigrants | West Indies | 3.7 /100 | #234 | Tragic $40,763 |
| Immigrants | Guyana | 3.6 /100 | #235 | Tragic $40,742 |
| Immigrants | Nonimmigrants | 3.4 /100 | #236 | Tragic $40,669 |
| Immigrants | Cambodia | 2.6 /100 | #237 | Tragic $40,434 |
| Somalis | 2.4 /100 | #238 | Tragic $40,367 |
| Tsimshian | 2.4 /100 | #239 | Tragic $40,344 |
| Immigrants | Nigeria | 2.3 /100 | #240 | Tragic $40,339 |
| British West Indians | 2.3 /100 | #241 | Tragic $40,330 |
| Immigrants | Western Africa | 2.2 /100 | #242 | Tragic $40,294 |
| German Russians | 2.2 /100 | #243 | Tragic $40,266 |
| French American Indians | 2.1 /100 | #244 | Tragic $40,244 |