Immigrants from Thailand vs German Per Capita Income
COMPARE
Immigrants from Thailand
German
Per Capita Income
Per Capita Income Comparison
Immigrants from Thailand
Germans
$42,289
PER CAPITA INCOME
17.6/ 100
METRIC RATING
201st/ 347
METRIC RANK
$43,067
PER CAPITA INCOME
33.9/ 100
METRIC RATING
183rd/ 347
METRIC RANK
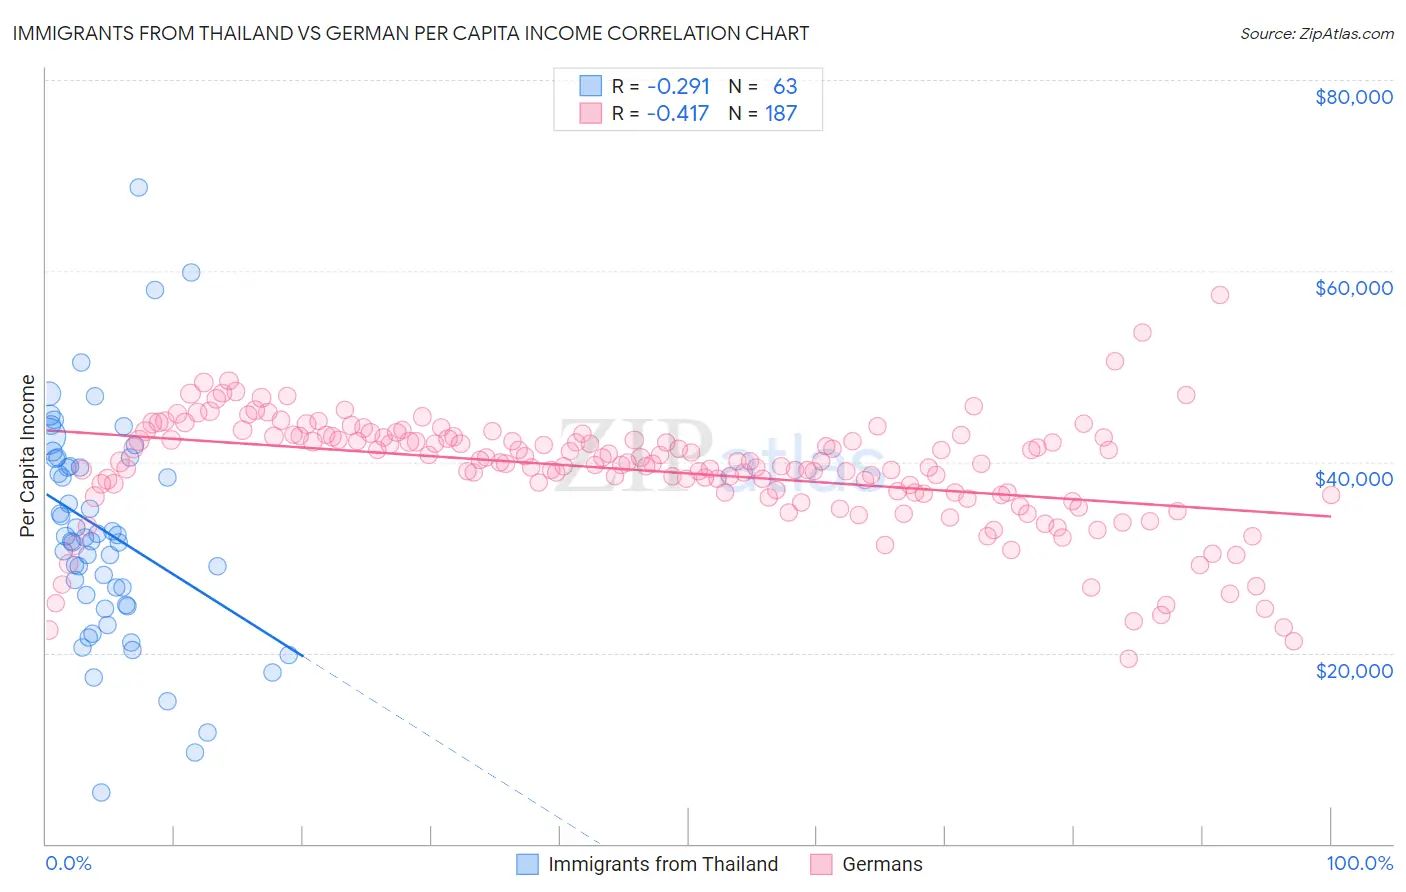
Immigrants from Thailand vs German Per Capita Income Correlation Chart
The statistical analysis conducted on geographies consisting of 317,026,349 people shows a weak negative correlation between the proportion of Immigrants from Thailand and per capita income in the United States with a correlation coefficient (R) of -0.291 and weighted average of $42,289. Similarly, the statistical analysis conducted on geographies consisting of 581,359,924 people shows a moderate negative correlation between the proportion of Germans and per capita income in the United States with a correlation coefficient (R) of -0.417 and weighted average of $43,067, a difference of 1.8%.
Per Capita Income Correlation Summary
| Measurement | Immigrants from Thailand | German |
| Minimum | $5,324 | $19,415 |
| Maximum | $68,712 | $57,467 |
| Range | $63,388 | $38,052 |
| Mean | $32,742 | $39,066 |
| Median | $32,020 | $39,927 |
| Interquartile 25% (IQ1) | $24,989 | $36,606 |
| Interquartile 75% (IQ3) | $40,306 | $42,630 |
| Interquartile Range (IQR) | $15,317 | $6,024 |
| Standard Deviation (Sample) | $11,676 | $5,932 |
| Standard Deviation (Population) | $11,583 | $5,916 |
Demographics Similar to Immigrants from Thailand and Germans by Per Capita Income
In terms of per capita income, the demographic groups most similar to Immigrants from Thailand are Immigrants from Bosnia and Herzegovina ($42,278, a difference of 0.030%), Vietnamese ($42,368, a difference of 0.19%), Barbadian ($42,406, a difference of 0.28%), Immigrants from Portugal ($42,412, a difference of 0.29%), and Scotch-Irish ($42,563, a difference of 0.65%). Similarly, the demographic groups most similar to Germans are Spaniard ($43,028, a difference of 0.090%), Immigrants ($43,010, a difference of 0.13%), French Canadian ($43,003, a difference of 0.15%), Immigrants from Colombia ($42,971, a difference of 0.22%), and Immigrants from Africa ($42,950, a difference of 0.27%).
| Demographics | Rating | Rank | Per Capita Income |
| Immigrants | Vietnam | 38.1 /100 | #182 | Fair $43,229 |
| Germans | 33.9 /100 | #183 | Fair $43,067 |
| Spaniards | 32.9 /100 | #184 | Fair $43,028 |
| Immigrants | Immigrants | 32.5 /100 | #185 | Fair $43,010 |
| French Canadians | 32.3 /100 | #186 | Fair $43,003 |
| Immigrants | Colombia | 31.5 /100 | #187 | Fair $42,971 |
| Immigrants | Africa | 31.0 /100 | #188 | Fair $42,950 |
| Bermudans | 30.1 /100 | #189 | Fair $42,911 |
| Kenyans | 27.7 /100 | #190 | Fair $42,808 |
| Yugoslavians | 27.4 /100 | #191 | Fair $42,792 |
| Iraqis | 26.7 /100 | #192 | Fair $42,760 |
| Immigrants | Sierra Leone | 26.5 /100 | #193 | Fair $42,752 |
| Immigrants | Fiji | 25.2 /100 | #194 | Fair $42,694 |
| Immigrants | Kenya | 24.5 /100 | #195 | Fair $42,661 |
| Dutch | 23.4 /100 | #196 | Fair $42,605 |
| Scotch-Irish | 22.6 /100 | #197 | Fair $42,563 |
| Immigrants | Portugal | 19.7 /100 | #198 | Poor $42,412 |
| Barbadians | 19.6 /100 | #199 | Poor $42,406 |
| Vietnamese | 19.0 /100 | #200 | Poor $42,368 |
| Immigrants | Thailand | 17.6 /100 | #201 | Poor $42,289 |
| Immigrants | Bosnia and Herzegovina | 17.5 /100 | #202 | Poor $42,278 |