Hispanic or Latino vs Immigrants from Eastern Europe Median Family Income
COMPARE
Hispanic or Latino
Immigrants from Eastern Europe
Median Family Income
Median Family Income Comparison
Hispanics or Latinos
Immigrants from Eastern Europe
$85,647
MEDIAN FAMILY INCOME
0.0/ 100
METRIC RATING
303rd/ 347
METRIC RANK
$112,527
MEDIAN FAMILY INCOME
99.4/ 100
METRIC RATING
77th/ 347
METRIC RANK
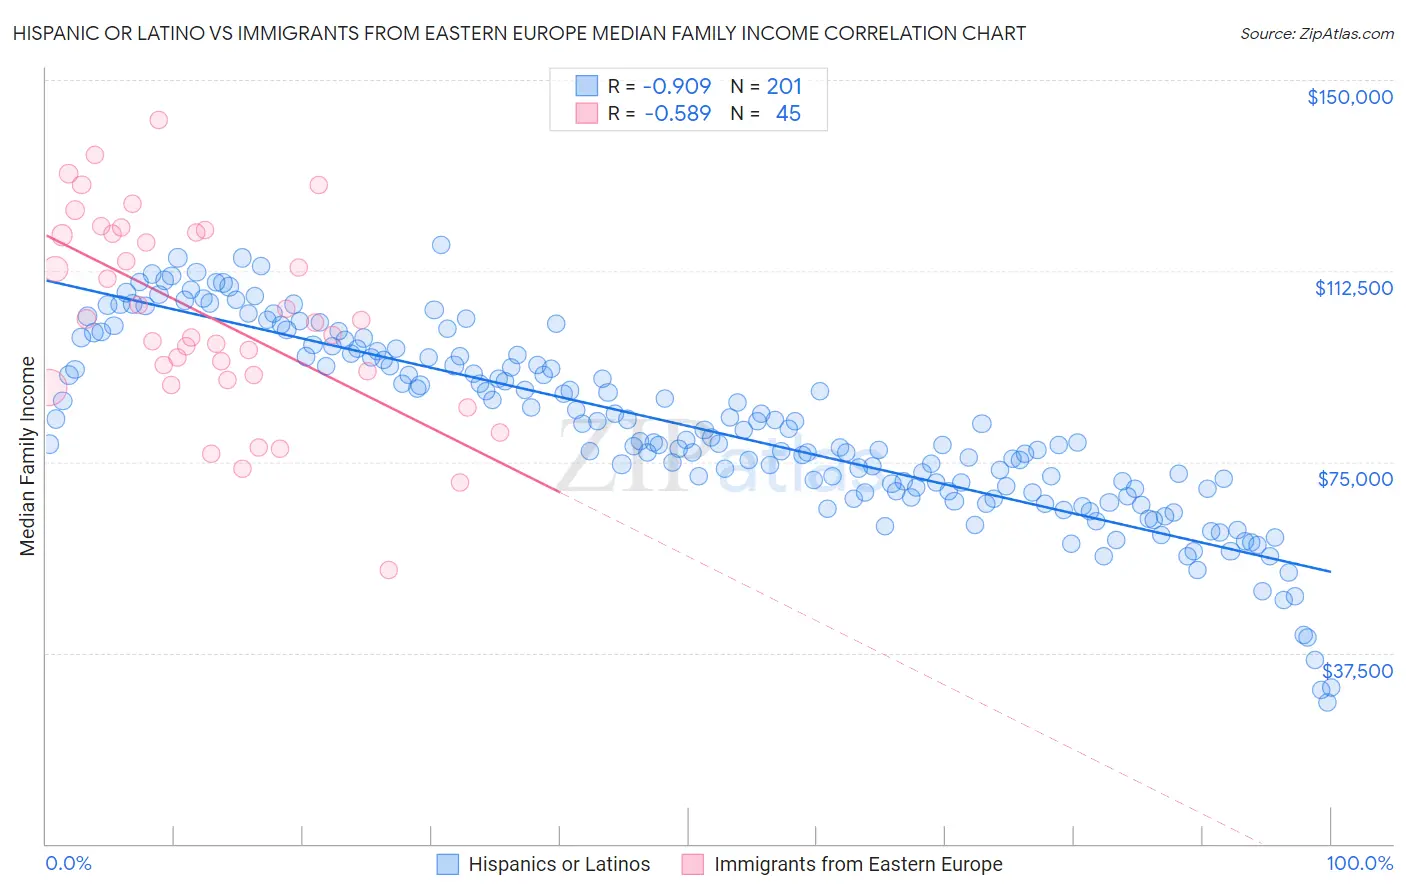
Hispanic or Latino vs Immigrants from Eastern Europe Median Family Income Correlation Chart
The statistical analysis conducted on geographies consisting of 576,861,643 people shows a near-perfect negative correlation between the proportion of Hispanics or Latinos and median family income in the United States with a correlation coefficient (R) of -0.909 and weighted average of $85,647. Similarly, the statistical analysis conducted on geographies consisting of 475,294,506 people shows a substantial negative correlation between the proportion of Immigrants from Eastern Europe and median family income in the United States with a correlation coefficient (R) of -0.589 and weighted average of $112,527, a difference of 31.4%.
Median Family Income Correlation Summary
| Measurement | Hispanic or Latino | Immigrants from Eastern Europe |
| Minimum | $27,753 | $53,863 |
| Maximum | $117,566 | $142,041 |
| Range | $89,813 | $88,178 |
| Mean | $81,882 | $103,481 |
| Median | $79,837 | $102,281 |
| Interquartile 25% (IQ1) | $69,539 | $91,657 |
| Interquartile 75% (IQ3) | $96,180 | $119,896 |
| Interquartile Range (IQR) | $26,641 | $28,238 |
| Standard Deviation (Sample) | $18,312 | $19,233 |
| Standard Deviation (Population) | $18,267 | $19,018 |
Similar Demographics by Median Family Income
Demographics Similar to Hispanics or Latinos by Median Family Income
In terms of median family income, the demographic groups most similar to Hispanics or Latinos are Mexican ($85,618, a difference of 0.030%), Spanish American Indian ($85,728, a difference of 0.090%), Colville ($85,792, a difference of 0.17%), Paiute ($85,414, a difference of 0.27%), and Immigrants from Dominica ($85,411, a difference of 0.28%).
| Demographics | Rating | Rank | Median Family Income |
| Immigrants | Guatemala | 0.0 /100 | #296 | Tragic $87,191 |
| Cajuns | 0.0 /100 | #297 | Tragic $87,157 |
| Immigrants | Latin America | 0.0 /100 | #298 | Tragic $86,989 |
| Chippewa | 0.0 /100 | #299 | Tragic $86,852 |
| Ottawa | 0.0 /100 | #300 | Tragic $86,380 |
| Colville | 0.0 /100 | #301 | Tragic $85,792 |
| Spanish American Indians | 0.0 /100 | #302 | Tragic $85,728 |
| Hispanics or Latinos | 0.0 /100 | #303 | Tragic $85,647 |
| Mexicans | 0.0 /100 | #304 | Tragic $85,618 |
| Paiute | 0.0 /100 | #305 | Tragic $85,414 |
| Immigrants | Dominica | 0.0 /100 | #306 | Tragic $85,411 |
| Chickasaw | 0.0 /100 | #307 | Tragic $85,356 |
| U.S. Virgin Islanders | 0.0 /100 | #308 | Tragic $85,294 |
| Haitians | 0.0 /100 | #309 | Tragic $85,218 |
| Immigrants | Central America | 0.0 /100 | #310 | Tragic $85,050 |
Demographics Similar to Immigrants from Eastern Europe by Median Family Income
In terms of median family income, the demographic groups most similar to Immigrants from Eastern Europe are Argentinean ($112,665, a difference of 0.12%), Immigrants from Western Europe ($112,688, a difference of 0.14%), Immigrants from Canada ($112,374, a difference of 0.14%), Italian ($112,372, a difference of 0.14%), and Immigrants from Croatia ($112,323, a difference of 0.18%).
| Demographics | Rating | Rank | Median Family Income |
| Immigrants | Romania | 99.6 /100 | #70 | Exceptional $113,434 |
| South Africans | 99.5 /100 | #71 | Exceptional $113,229 |
| Afghans | 99.5 /100 | #72 | Exceptional $112,971 |
| Laotians | 99.5 /100 | #73 | Exceptional $112,859 |
| Immigrants | Italy | 99.4 /100 | #74 | Exceptional $112,848 |
| Immigrants | Western Europe | 99.4 /100 | #75 | Exceptional $112,688 |
| Argentineans | 99.4 /100 | #76 | Exceptional $112,665 |
| Immigrants | Eastern Europe | 99.4 /100 | #77 | Exceptional $112,527 |
| Immigrants | Canada | 99.3 /100 | #78 | Exceptional $112,374 |
| Italians | 99.3 /100 | #79 | Exceptional $112,372 |
| Immigrants | Croatia | 99.3 /100 | #80 | Exceptional $112,323 |
| Immigrants | North America | 99.2 /100 | #81 | Exceptional $112,151 |
| Immigrants | England | 99.2 /100 | #82 | Exceptional $112,038 |
| Immigrants | Egypt | 99.0 /100 | #83 | Exceptional $111,689 |
| Immigrants | Hungary | 98.8 /100 | #84 | Exceptional $111,378 |