Iroquois vs Immigrants from Asia Per Capita Income
COMPARE
Iroquois
Immigrants from Asia
Per Capita Income
Per Capita Income Comparison
Iroquois
Immigrants from Asia
$39,104
PER CAPITA INCOME
0.6/ 100
METRIC RATING
262nd/ 347
METRIC RANK
$49,741
PER CAPITA INCOME
99.9/ 100
METRIC RATING
62nd/ 347
METRIC RANK
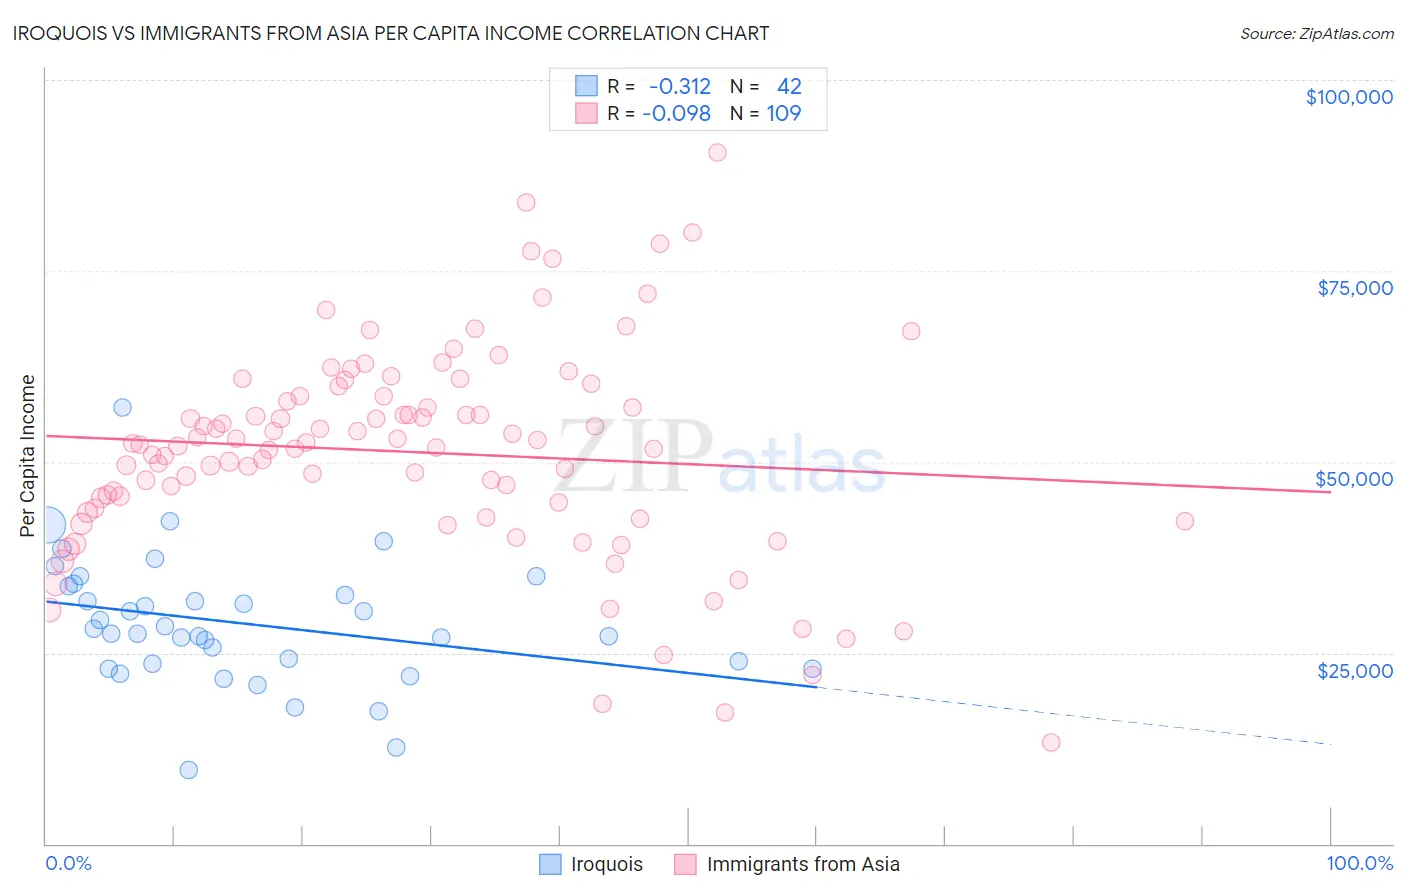
Iroquois vs Immigrants from Asia Per Capita Income Correlation Chart
The statistical analysis conducted on geographies consisting of 207,308,382 people shows a mild negative correlation between the proportion of Iroquois and per capita income in the United States with a correlation coefficient (R) of -0.312 and weighted average of $39,104. Similarly, the statistical analysis conducted on geographies consisting of 549,218,317 people shows a slight negative correlation between the proportion of Immigrants from Asia and per capita income in the United States with a correlation coefficient (R) of -0.098 and weighted average of $49,741, a difference of 27.2%.
Per Capita Income Correlation Summary
| Measurement | Iroquois | Immigrants from Asia |
| Minimum | $9,644 | $13,219 |
| Maximum | $57,083 | $90,491 |
| Range | $47,439 | $77,273 |
| Mean | $28,880 | $51,284 |
| Median | $27,852 | $52,258 |
| Interquartile 25% (IQ1) | $23,617 | $43,660 |
| Interquartile 75% (IQ3) | $33,731 | $58,564 |
| Interquartile Range (IQR) | $10,114 | $14,904 |
| Standard Deviation (Sample) | $8,453 | $13,798 |
| Standard Deviation (Population) | $8,352 | $13,734 |
Similar Demographics by Per Capita Income
Demographics Similar to Iroquois by Per Capita Income
In terms of per capita income, the demographic groups most similar to Iroquois are Marshallese ($39,108, a difference of 0.010%), Belizean ($39,097, a difference of 0.020%), Alaskan Athabascan ($39,163, a difference of 0.15%), American ($39,039, a difference of 0.16%), and Malaysian ($39,194, a difference of 0.23%).
| Demographics | Rating | Rank | Per Capita Income |
| Immigrants | Middle Africa | 1.0 /100 | #255 | Tragic $39,529 |
| Hawaiians | 0.8 /100 | #256 | Tragic $39,403 |
| Nicaraguans | 0.8 /100 | #257 | Tragic $39,372 |
| Jamaicans | 0.7 /100 | #258 | Tragic $39,231 |
| Malaysians | 0.7 /100 | #259 | Tragic $39,194 |
| Alaskan Athabascans | 0.6 /100 | #260 | Tragic $39,163 |
| Marshallese | 0.6 /100 | #261 | Tragic $39,108 |
| Iroquois | 0.6 /100 | #262 | Tragic $39,104 |
| Belizeans | 0.6 /100 | #263 | Tragic $39,097 |
| Americans | 0.6 /100 | #264 | Tragic $39,039 |
| Spanish Americans | 0.5 /100 | #265 | Tragic $39,012 |
| Salvadorans | 0.5 /100 | #266 | Tragic $38,858 |
| Immigrants | Zaire | 0.4 /100 | #267 | Tragic $38,848 |
| Liberians | 0.4 /100 | #268 | Tragic $38,780 |
| Immigrants | Jamaica | 0.4 /100 | #269 | Tragic $38,766 |
Demographics Similar to Immigrants from Asia by Per Capita Income
In terms of per capita income, the demographic groups most similar to Immigrants from Asia are Maltese ($49,640, a difference of 0.20%), Immigrants from Argentina ($49,627, a difference of 0.23%), Argentinean ($49,862, a difference of 0.24%), Bhutanese ($49,894, a difference of 0.31%), and Immigrants from Scotland ($49,893, a difference of 0.31%).
| Demographics | Rating | Rank | Per Capita Income |
| Immigrants | Western Europe | 99.9 /100 | #55 | Exceptional $50,065 |
| Asians | 99.9 /100 | #56 | Exceptional $50,057 |
| South Africans | 99.9 /100 | #57 | Exceptional $50,044 |
| Immigrants | Malaysia | 99.9 /100 | #58 | Exceptional $49,983 |
| Bhutanese | 99.9 /100 | #59 | Exceptional $49,894 |
| Immigrants | Scotland | 99.9 /100 | #60 | Exceptional $49,893 |
| Argentineans | 99.9 /100 | #61 | Exceptional $49,862 |
| Immigrants | Asia | 99.9 /100 | #62 | Exceptional $49,741 |
| Maltese | 99.9 /100 | #63 | Exceptional $49,640 |
| Immigrants | Argentina | 99.9 /100 | #64 | Exceptional $49,627 |
| Bolivians | 99.9 /100 | #65 | Exceptional $49,526 |
| Immigrants | Bulgaria | 99.9 /100 | #66 | Exceptional $49,482 |
| Immigrants | Romania | 99.9 /100 | #67 | Exceptional $49,463 |
| Lithuanians | 99.8 /100 | #68 | Exceptional $49,448 |
| Immigrants | Canada | 99.8 /100 | #69 | Exceptional $49,412 |