Iroquois vs Immigrants from Iran Per Capita Income
COMPARE
Iroquois
Immigrants from Iran
Per Capita Income
Per Capita Income Comparison
Iroquois
Immigrants from Iran
$39,104
PER CAPITA INCOME
0.6/ 100
METRIC RATING
262nd/ 347
METRIC RANK
$57,759
PER CAPITA INCOME
100.0/ 100
METRIC RATING
5th/ 347
METRIC RANK
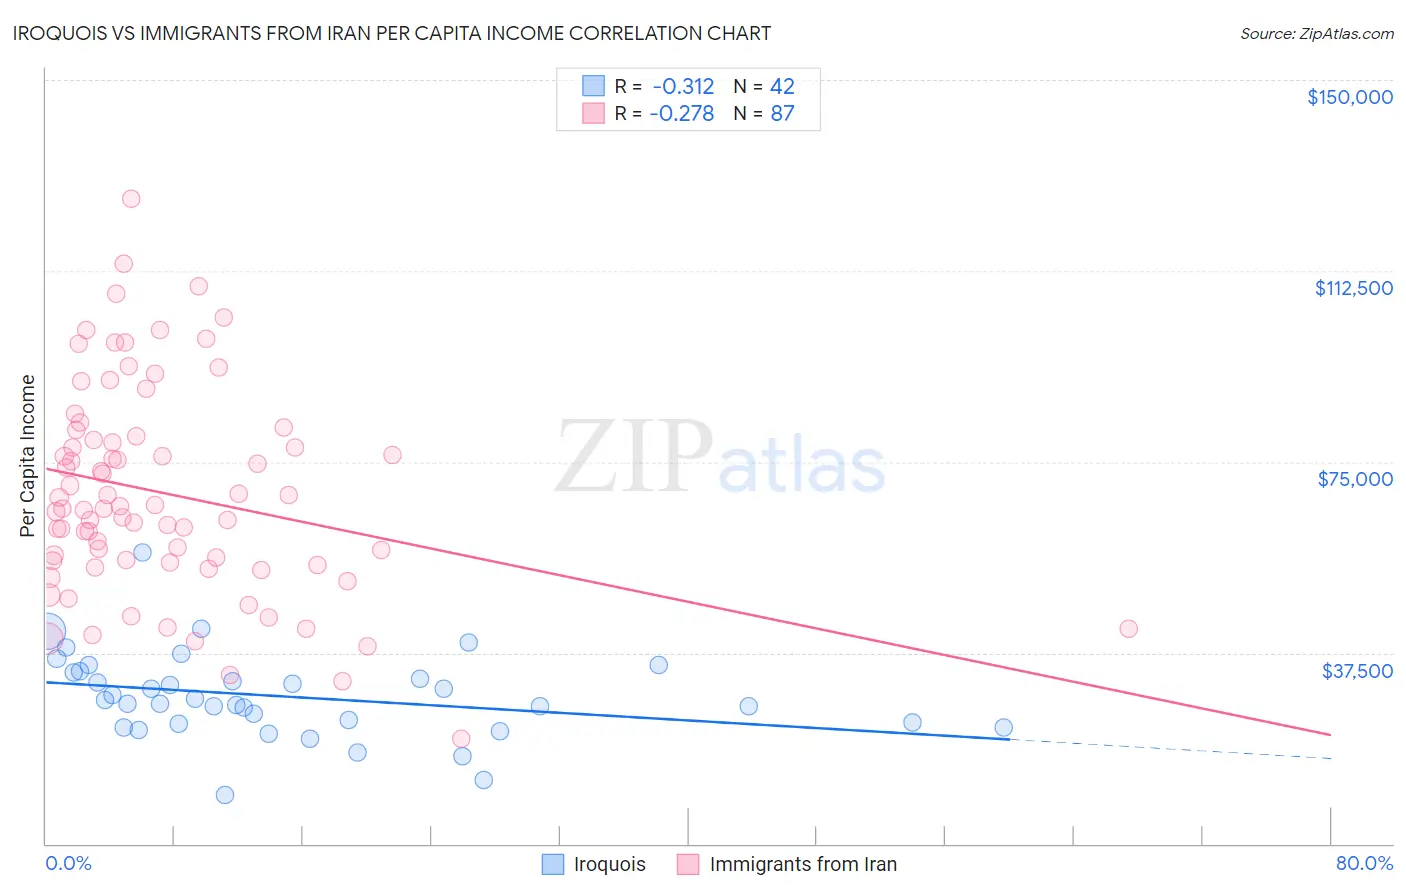
Iroquois vs Immigrants from Iran Per Capita Income Correlation Chart
The statistical analysis conducted on geographies consisting of 207,308,382 people shows a mild negative correlation between the proportion of Iroquois and per capita income in the United States with a correlation coefficient (R) of -0.312 and weighted average of $39,104. Similarly, the statistical analysis conducted on geographies consisting of 279,905,207 people shows a weak negative correlation between the proportion of Immigrants from Iran and per capita income in the United States with a correlation coefficient (R) of -0.278 and weighted average of $57,759, a difference of 47.7%.
Per Capita Income Correlation Summary
| Measurement | Iroquois | Immigrants from Iran |
| Minimum | $9,644 | $20,655 |
| Maximum | $57,083 | $126,563 |
| Range | $47,439 | $105,908 |
| Mean | $28,880 | $68,785 |
| Median | $27,852 | $65,816 |
| Interquartile 25% (IQ1) | $23,617 | $55,345 |
| Interquartile 75% (IQ3) | $33,731 | $79,969 |
| Interquartile Range (IQR) | $10,114 | $24,624 |
| Standard Deviation (Sample) | $8,453 | $20,524 |
| Standard Deviation (Population) | $8,352 | $20,406 |
Similar Demographics by Per Capita Income
Demographics Similar to Iroquois by Per Capita Income
In terms of per capita income, the demographic groups most similar to Iroquois are Marshallese ($39,108, a difference of 0.010%), Belizean ($39,097, a difference of 0.020%), Alaskan Athabascan ($39,163, a difference of 0.15%), American ($39,039, a difference of 0.16%), and Malaysian ($39,194, a difference of 0.23%).
| Demographics | Rating | Rank | Per Capita Income |
| Immigrants | Middle Africa | 1.0 /100 | #255 | Tragic $39,529 |
| Hawaiians | 0.8 /100 | #256 | Tragic $39,403 |
| Nicaraguans | 0.8 /100 | #257 | Tragic $39,372 |
| Jamaicans | 0.7 /100 | #258 | Tragic $39,231 |
| Malaysians | 0.7 /100 | #259 | Tragic $39,194 |
| Alaskan Athabascans | 0.6 /100 | #260 | Tragic $39,163 |
| Marshallese | 0.6 /100 | #261 | Tragic $39,108 |
| Iroquois | 0.6 /100 | #262 | Tragic $39,104 |
| Belizeans | 0.6 /100 | #263 | Tragic $39,097 |
| Americans | 0.6 /100 | #264 | Tragic $39,039 |
| Spanish Americans | 0.5 /100 | #265 | Tragic $39,012 |
| Salvadorans | 0.5 /100 | #266 | Tragic $38,858 |
| Immigrants | Zaire | 0.4 /100 | #267 | Tragic $38,848 |
| Liberians | 0.4 /100 | #268 | Tragic $38,780 |
| Immigrants | Jamaica | 0.4 /100 | #269 | Tragic $38,766 |
Demographics Similar to Immigrants from Iran by Per Capita Income
In terms of per capita income, the demographic groups most similar to Immigrants from Iran are Immigrants from Taiwan ($57,742, a difference of 0.030%), Immigrants from Australia ($57,953, a difference of 0.34%), Immigrants from Israel ($57,384, a difference of 0.65%), Immigrants from Singapore ($58,353, a difference of 1.0%), and Iranian ($58,786, a difference of 1.8%).
| Demographics | Rating | Rank | Per Capita Income |
| Filipinos | 100.0 /100 | #1 | Exceptional $59,066 |
| Iranians | 100.0 /100 | #2 | Exceptional $58,786 |
| Immigrants | Singapore | 100.0 /100 | #3 | Exceptional $58,353 |
| Immigrants | Australia | 100.0 /100 | #4 | Exceptional $57,953 |
| Immigrants | Iran | 100.0 /100 | #5 | Exceptional $57,759 |
| Immigrants | Taiwan | 100.0 /100 | #6 | Exceptional $57,742 |
| Immigrants | Israel | 100.0 /100 | #7 | Exceptional $57,384 |
| Immigrants | Hong Kong | 100.0 /100 | #8 | Exceptional $56,709 |
| Immigrants | Ireland | 100.0 /100 | #9 | Exceptional $56,584 |
| Okinawans | 100.0 /100 | #10 | Exceptional $55,817 |
| Eastern Europeans | 100.0 /100 | #11 | Exceptional $55,780 |
| Immigrants | Sweden | 100.0 /100 | #12 | Exceptional $55,582 |
| Immigrants | India | 100.0 /100 | #13 | Exceptional $55,268 |
| Immigrants | Belgium | 100.0 /100 | #14 | Exceptional $55,082 |
| Cypriots | 100.0 /100 | #15 | Exceptional $54,899 |