Iroquois vs Immigrants from Fiji Unemployment Among Women with Children Under 6 years
COMPARE
Iroquois
Immigrants from Fiji
Unemployment Among Women with Children Under 6 years
Unemployment Among Women with Children Under 6 years Comparison
Iroquois
Immigrants from Fiji
8.7%
UNEMPLOYMENT AMONG WOMEN WITH CHILDREN UNDER 6 YEARS
0.0/ 100
METRIC RATING
289th/ 347
METRIC RANK
7.1%
UNEMPLOYMENT AMONG WOMEN WITH CHILDREN UNDER 6 YEARS
98.9/ 100
METRIC RATING
79th/ 347
METRIC RANK
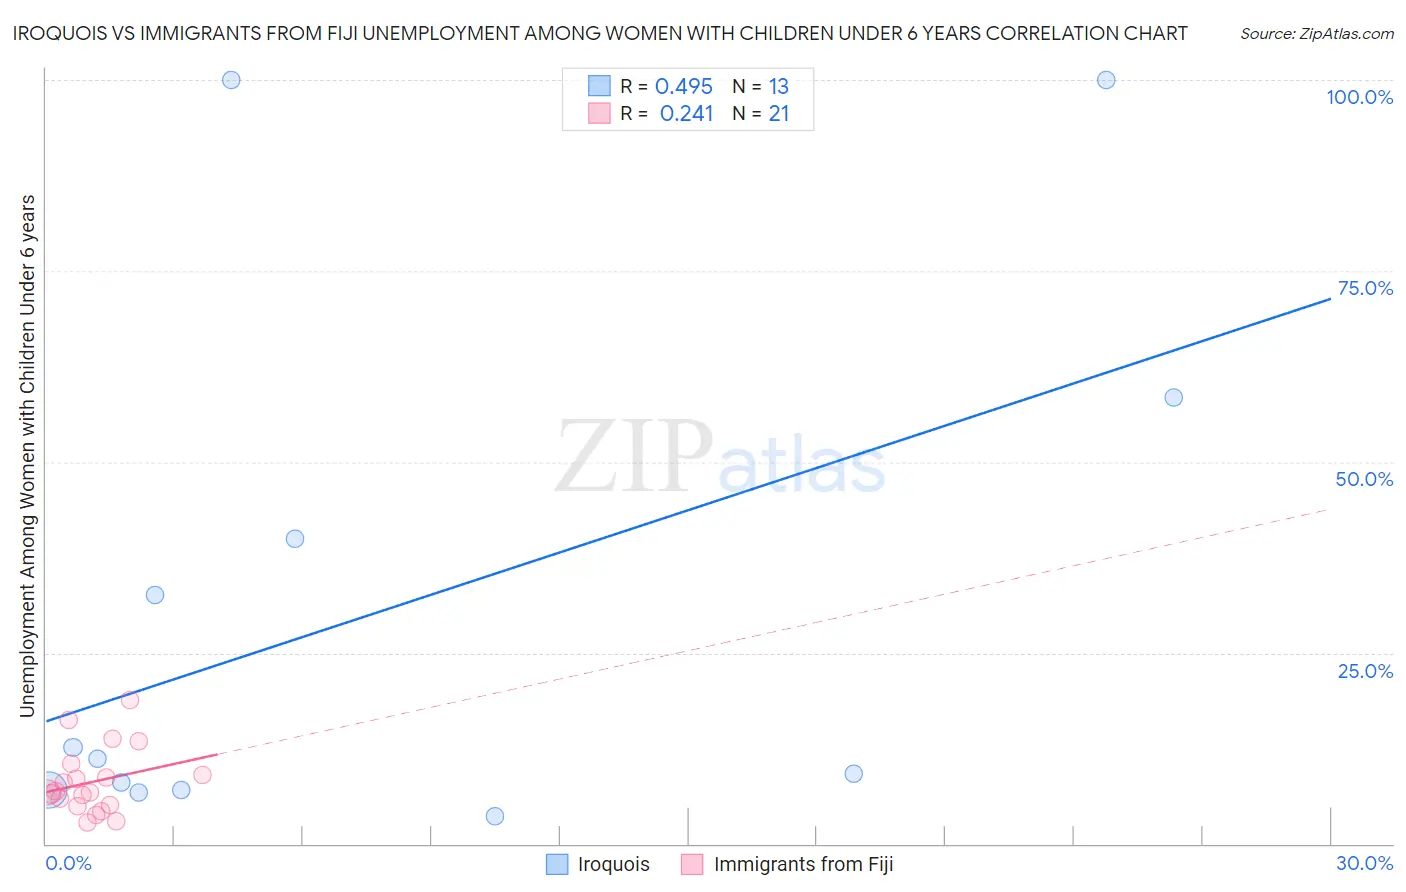
Iroquois vs Immigrants from Fiji Unemployment Among Women with Children Under 6 years Correlation Chart
The statistical analysis conducted on geographies consisting of 170,660,150 people shows a moderate positive correlation between the proportion of Iroquois and unemployment rate among women with children under the age of 6 in the United States with a correlation coefficient (R) of 0.495 and weighted average of 8.7%. Similarly, the statistical analysis conducted on geographies consisting of 86,922,643 people shows a weak positive correlation between the proportion of Immigrants from Fiji and unemployment rate among women with children under the age of 6 in the United States with a correlation coefficient (R) of 0.241 and weighted average of 7.1%, a difference of 23.5%.
Unemployment Among Women with Children Under 6 years Correlation Summary
| Measurement | Iroquois | Immigrants from Fiji |
| Minimum | 3.6% | 2.8% |
| Maximum | 100.0% | 18.8% |
| Range | 96.4% | 16.0% |
| Mean | 30.5% | 8.1% |
| Median | 11.2% | 6.7% |
| Interquartile 25% (IQ1) | 7.1% | 5.1% |
| Interquartile 75% (IQ3) | 49.2% | 9.7% |
| Interquartile Range (IQR) | 42.2% | 4.7% |
| Standard Deviation (Sample) | 34.9% | 4.3% |
| Standard Deviation (Population) | 33.5% | 4.2% |
Similar Demographics by Unemployment Among Women with Children Under 6 years
Demographics Similar to Iroquois by Unemployment Among Women with Children Under 6 years
In terms of unemployment among women with children under 6 years, the demographic groups most similar to Iroquois are Bahamian (8.7%, a difference of 0.11%), Vietnamese (8.8%, a difference of 0.15%), Menominee (8.7%, a difference of 0.31%), U.S. Virgin Islander (8.7%, a difference of 0.46%), and Seminole (8.7%, a difference of 0.46%).
| Demographics | Rating | Rank | Unemployment Among Women with Children Under 6 years |
| Bermudans | 0.0 /100 | #282 | Tragic 8.7% |
| Spanish American Indians | 0.0 /100 | #283 | Tragic 8.7% |
| Blackfeet | 0.0 /100 | #284 | Tragic 8.7% |
| U.S. Virgin Islanders | 0.0 /100 | #285 | Tragic 8.7% |
| Seminole | 0.0 /100 | #286 | Tragic 8.7% |
| Menominee | 0.0 /100 | #287 | Tragic 8.7% |
| Bahamians | 0.0 /100 | #288 | Tragic 8.7% |
| Iroquois | 0.0 /100 | #289 | Tragic 8.7% |
| Vietnamese | 0.0 /100 | #290 | Tragic 8.8% |
| Jamaicans | 0.0 /100 | #291 | Tragic 8.8% |
| Cheyenne | 0.0 /100 | #292 | Tragic 8.8% |
| Immigrants | Bangladesh | 0.0 /100 | #293 | Tragic 8.8% |
| Immigrants | Nonimmigrants | 0.0 /100 | #294 | Tragic 8.8% |
| Immigrants | Central America | 0.0 /100 | #295 | Tragic 8.9% |
| Immigrants | Dominican Republic | 0.0 /100 | #296 | Tragic 8.9% |
Demographics Similar to Immigrants from Fiji by Unemployment Among Women with Children Under 6 years
In terms of unemployment among women with children under 6 years, the demographic groups most similar to Immigrants from Fiji are Immigrants from Greece (7.1%, a difference of 0.020%), Immigrants from Somalia (7.1%, a difference of 0.050%), Immigrants from Venezuela (7.1%, a difference of 0.060%), Immigrants from Croatia (7.1%, a difference of 0.090%), and Estonian (7.1%, a difference of 0.12%).
| Demographics | Rating | Rank | Unemployment Among Women with Children Under 6 years |
| Cubans | 99.4 /100 | #72 | Exceptional 7.0% |
| Immigrants | Czechoslovakia | 99.2 /100 | #73 | Exceptional 7.0% |
| Turks | 99.2 /100 | #74 | Exceptional 7.0% |
| Immigrants | Eastern Europe | 99.0 /100 | #75 | Exceptional 7.1% |
| Estonians | 99.0 /100 | #76 | Exceptional 7.1% |
| Immigrants | Croatia | 98.9 /100 | #77 | Exceptional 7.1% |
| Immigrants | Somalia | 98.9 /100 | #78 | Exceptional 7.1% |
| Immigrants | Fiji | 98.9 /100 | #79 | Exceptional 7.1% |
| Immigrants | Greece | 98.9 /100 | #80 | Exceptional 7.1% |
| Immigrants | Venezuela | 98.8 /100 | #81 | Exceptional 7.1% |
| Immigrants | Afghanistan | 98.7 /100 | #82 | Exceptional 7.1% |
| Egyptians | 98.7 /100 | #83 | Exceptional 7.1% |
| Immigrants | Albania | 98.7 /100 | #84 | Exceptional 7.1% |
| Immigrants | Romania | 98.7 /100 | #85 | Exceptional 7.1% |
| Immigrants | Zimbabwe | 98.6 /100 | #86 | Exceptional 7.1% |