Iroquois vs Liberian Householder Income Over 65 years
COMPARE
Iroquois
Liberian
Householder Income Over 65 years
Householder Income Over 65 years Comparison
Iroquois
Liberians
$53,737
HOUSEHOLDER INCOME OVER 65 YEARS
0.1/ 100
METRIC RATING
289th/ 347
METRIC RANK
$54,356
HOUSEHOLDER INCOME OVER 65 YEARS
0.1/ 100
METRIC RATING
271st/ 347
METRIC RANK
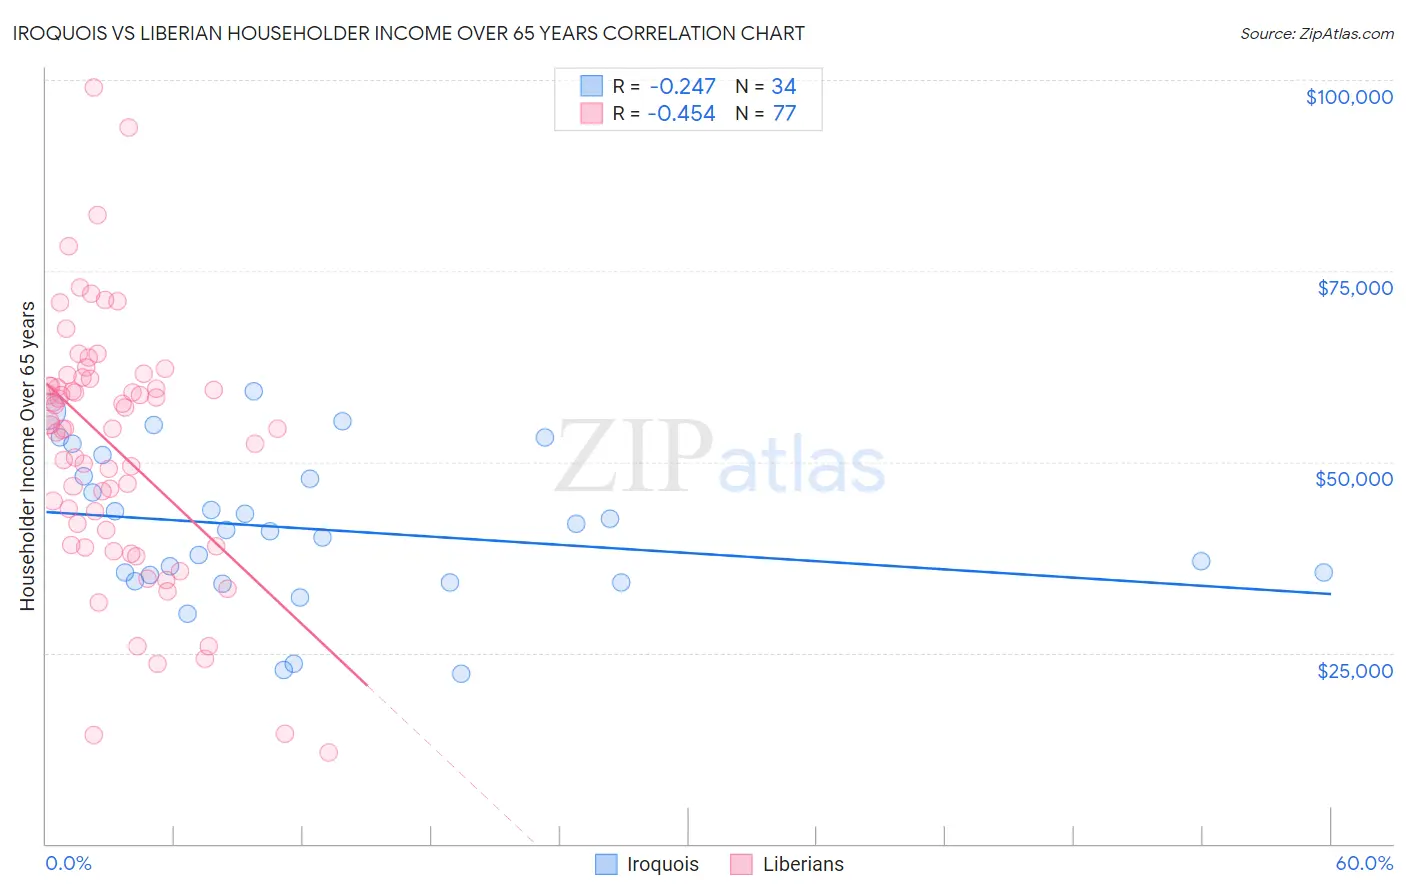
Iroquois vs Liberian Householder Income Over 65 years Correlation Chart
The statistical analysis conducted on geographies consisting of 206,830,612 people shows a weak negative correlation between the proportion of Iroquois and household income with householder over the age of 65 in the United States with a correlation coefficient (R) of -0.247 and weighted average of $53,737. Similarly, the statistical analysis conducted on geographies consisting of 117,884,771 people shows a moderate negative correlation between the proportion of Liberians and household income with householder over the age of 65 in the United States with a correlation coefficient (R) of -0.454 and weighted average of $54,356, a difference of 1.1%.
Householder Income Over 65 years Correlation Summary
| Measurement | Iroquois | Liberian |
| Minimum | $22,212 | $12,021 |
| Maximum | $59,317 | $98,942 |
| Range | $37,105 | $86,921 |
| Mean | $41,171 | $51,904 |
| Median | $40,975 | $54,398 |
| Interquartile 25% (IQ1) | $34,309 | $40,027 |
| Interquartile 75% (IQ3) | $48,128 | $60,409 |
| Interquartile Range (IQR) | $13,819 | $20,383 |
| Standard Deviation (Sample) | $9,770 | $16,445 |
| Standard Deviation (Population) | $9,625 | $16,338 |
Demographics Similar to Iroquois and Liberians by Householder Income Over 65 years
In terms of householder income over 65 years, the demographic groups most similar to Iroquois are Chickasaw ($53,732, a difference of 0.010%), Immigrants from Barbados ($53,766, a difference of 0.050%), Paiute ($53,762, a difference of 0.050%), Chippewa ($53,847, a difference of 0.21%), and Mexican ($53,897, a difference of 0.30%). Similarly, the demographic groups most similar to Liberians are Immigrants from Senegal ($54,447, a difference of 0.17%), Potawatomi ($54,212, a difference of 0.27%), Indonesian ($54,176, a difference of 0.33%), Barbadian ($54,163, a difference of 0.36%), and Cherokee ($54,133, a difference of 0.41%).
| Demographics | Rating | Rank | Householder Income Over 65 years |
| Immigrants | Senegal | 0.1 /100 | #270 | Tragic $54,447 |
| Liberians | 0.1 /100 | #271 | Tragic $54,356 |
| Potawatomi | 0.1 /100 | #272 | Tragic $54,212 |
| Indonesians | 0.1 /100 | #273 | Tragic $54,176 |
| Barbadians | 0.1 /100 | #274 | Tragic $54,163 |
| Cherokee | 0.1 /100 | #275 | Tragic $54,133 |
| Cree | 0.1 /100 | #276 | Tragic $54,129 |
| Cheyenne | 0.1 /100 | #277 | Tragic $54,096 |
| Immigrants | Ecuador | 0.1 /100 | #278 | Tragic $54,030 |
| Blackfeet | 0.1 /100 | #279 | Tragic $54,029 |
| Immigrants | Jamaica | 0.1 /100 | #280 | Tragic $54,027 |
| Somalis | 0.1 /100 | #281 | Tragic $54,004 |
| Immigrants | Armenia | 0.1 /100 | #282 | Tragic $53,974 |
| Immigrants | Liberia | 0.1 /100 | #283 | Tragic $53,967 |
| Immigrants | Guatemala | 0.1 /100 | #284 | Tragic $53,950 |
| Mexicans | 0.1 /100 | #285 | Tragic $53,897 |
| Chippewa | 0.1 /100 | #286 | Tragic $53,847 |
| Immigrants | Barbados | 0.1 /100 | #287 | Tragic $53,766 |
| Paiute | 0.1 /100 | #288 | Tragic $53,762 |
| Iroquois | 0.1 /100 | #289 | Tragic $53,737 |
| Chickasaw | 0.1 /100 | #290 | Tragic $53,732 |