Iroquois vs Guamanian/Chamorro Householder Income Over 65 years
COMPARE
Iroquois
Guamanian/Chamorro
Householder Income Over 65 years
Householder Income Over 65 years Comparison
Iroquois
Guamanians/Chamorros
$53,737
HOUSEHOLDER INCOME OVER 65 YEARS
0.1/ 100
METRIC RATING
289th/ 347
METRIC RANK
$63,187
HOUSEHOLDER INCOME OVER 65 YEARS
91.1/ 100
METRIC RATING
116th/ 347
METRIC RANK
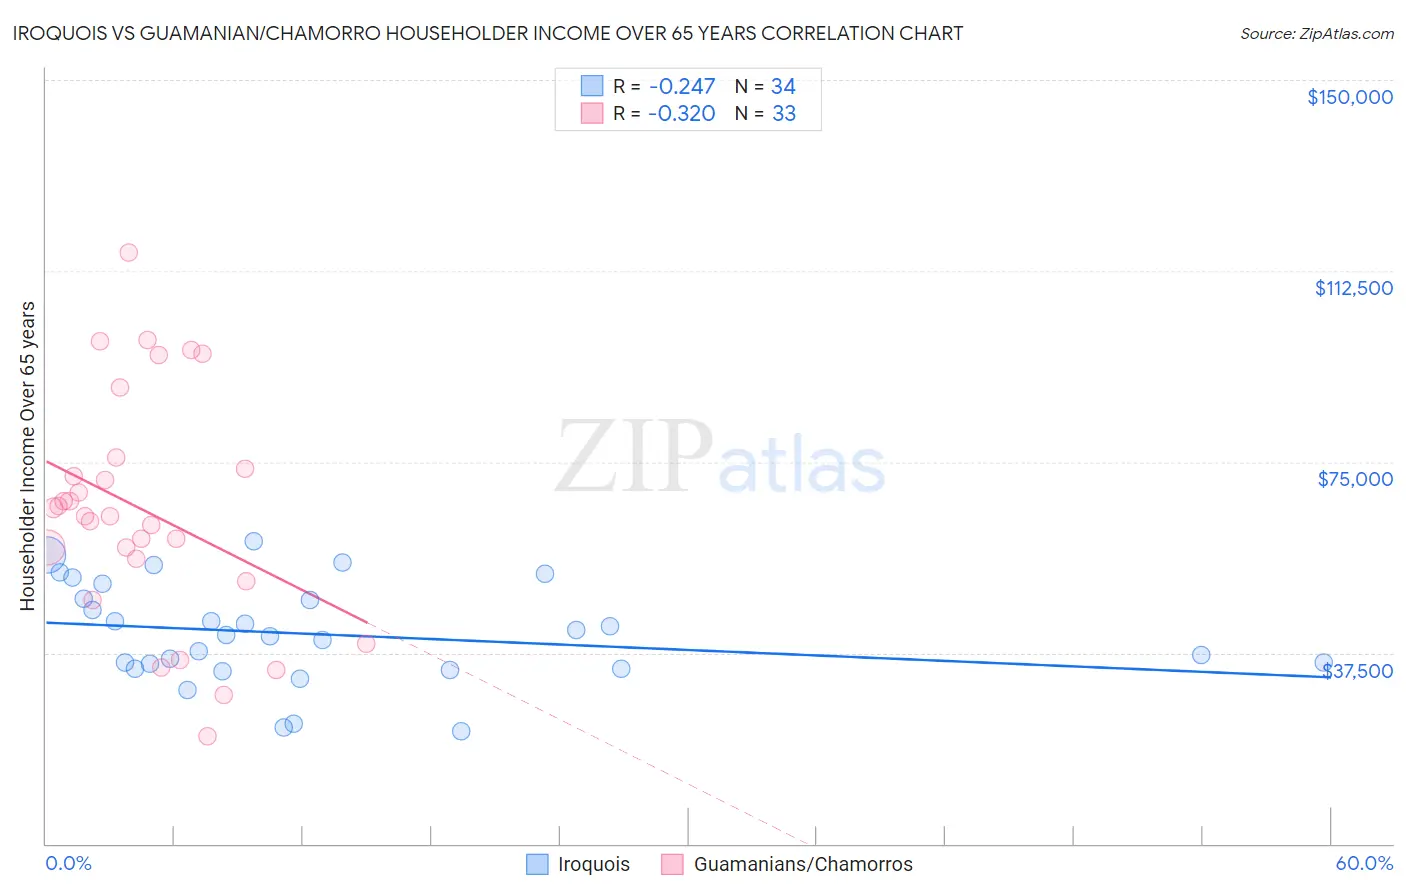
Iroquois vs Guamanian/Chamorro Householder Income Over 65 years Correlation Chart
The statistical analysis conducted on geographies consisting of 206,830,612 people shows a weak negative correlation between the proportion of Iroquois and household income with householder over the age of 65 in the United States with a correlation coefficient (R) of -0.247 and weighted average of $53,737. Similarly, the statistical analysis conducted on geographies consisting of 221,091,968 people shows a mild negative correlation between the proportion of Guamanians/Chamorros and household income with householder over the age of 65 in the United States with a correlation coefficient (R) of -0.320 and weighted average of $63,187, a difference of 17.6%.
Householder Income Over 65 years Correlation Summary
| Measurement | Iroquois | Guamanian/Chamorro |
| Minimum | $22,212 | $21,071 |
| Maximum | $59,317 | $116,094 |
| Range | $37,105 | $95,023 |
| Mean | $41,171 | $65,533 |
| Median | $40,975 | $64,389 |
| Interquartile 25% (IQ1) | $34,309 | $53,785 |
| Interquartile 75% (IQ3) | $48,128 | $74,861 |
| Interquartile Range (IQR) | $13,819 | $21,076 |
| Standard Deviation (Sample) | $9,770 | $22,403 |
| Standard Deviation (Population) | $9,625 | $22,061 |
Similar Demographics by Householder Income Over 65 years
Demographics Similar to Iroquois by Householder Income Over 65 years
In terms of householder income over 65 years, the demographic groups most similar to Iroquois are Chickasaw ($53,732, a difference of 0.010%), Immigrants from Barbados ($53,766, a difference of 0.050%), Paiute ($53,762, a difference of 0.050%), African ($53,711, a difference of 0.050%), and Shoshone ($53,681, a difference of 0.10%).
| Demographics | Rating | Rank | Householder Income Over 65 years |
| Immigrants | Armenia | 0.1 /100 | #282 | Tragic $53,974 |
| Immigrants | Liberia | 0.1 /100 | #283 | Tragic $53,967 |
| Immigrants | Guatemala | 0.1 /100 | #284 | Tragic $53,950 |
| Mexicans | 0.1 /100 | #285 | Tragic $53,897 |
| Chippewa | 0.1 /100 | #286 | Tragic $53,847 |
| Immigrants | Barbados | 0.1 /100 | #287 | Tragic $53,766 |
| Paiute | 0.1 /100 | #288 | Tragic $53,762 |
| Iroquois | 0.1 /100 | #289 | Tragic $53,737 |
| Chickasaw | 0.1 /100 | #290 | Tragic $53,732 |
| Africans | 0.0 /100 | #291 | Tragic $53,711 |
| Shoshone | 0.0 /100 | #292 | Tragic $53,681 |
| Immigrants | Belize | 0.0 /100 | #293 | Tragic $53,665 |
| Senegalese | 0.0 /100 | #294 | Tragic $53,591 |
| Immigrants | Central America | 0.0 /100 | #295 | Tragic $53,420 |
| Immigrants | Somalia | 0.0 /100 | #296 | Tragic $53,333 |
Demographics Similar to Guamanians/Chamorros by Householder Income Over 65 years
In terms of householder income over 65 years, the demographic groups most similar to Guamanians/Chamorros are Immigrants from Croatia ($63,168, a difference of 0.030%), Croatian ($63,225, a difference of 0.060%), Danish ($63,117, a difference of 0.11%), Immigrants from Jordan ($63,041, a difference of 0.23%), and Ukrainian ($63,032, a difference of 0.25%).
| Demographics | Rating | Rank | Householder Income Over 65 years |
| Europeans | 95.0 /100 | #109 | Exceptional $63,779 |
| Immigrants | Zimbabwe | 94.3 /100 | #110 | Exceptional $63,643 |
| Immigrants | Spain | 93.7 /100 | #111 | Exceptional $63,540 |
| Syrians | 93.4 /100 | #112 | Exceptional $63,494 |
| Immigrants | Serbia | 92.7 /100 | #113 | Exceptional $63,387 |
| Immigrants | Saudi Arabia | 92.4 /100 | #114 | Exceptional $63,355 |
| Croatians | 91.4 /100 | #115 | Exceptional $63,225 |
| Guamanians/Chamorros | 91.1 /100 | #116 | Exceptional $63,187 |
| Immigrants | Croatia | 90.9 /100 | #117 | Exceptional $63,168 |
| Danes | 90.5 /100 | #118 | Exceptional $63,117 |
| Immigrants | Jordan | 89.8 /100 | #119 | Excellent $63,041 |
| Ukrainians | 89.7 /100 | #120 | Excellent $63,032 |
| Immigrants | Vietnam | 89.5 /100 | #121 | Excellent $63,014 |
| Immigrants | Moldova | 88.7 /100 | #122 | Excellent $62,939 |
| Tlingit-Haida | 88.6 /100 | #123 | Excellent $62,922 |