Irish vs Cajun Median Male Earnings
COMPARE
Irish
Cajun
Median Male Earnings
Median Male Earnings Comparison
Irish
Cajuns
$56,464
MEDIAN MALE EARNINGS
87.4/ 100
METRIC RATING
135th/ 347
METRIC RANK
$52,325
MEDIAN MALE EARNINGS
10.7/ 100
METRIC RATING
212th/ 347
METRIC RANK
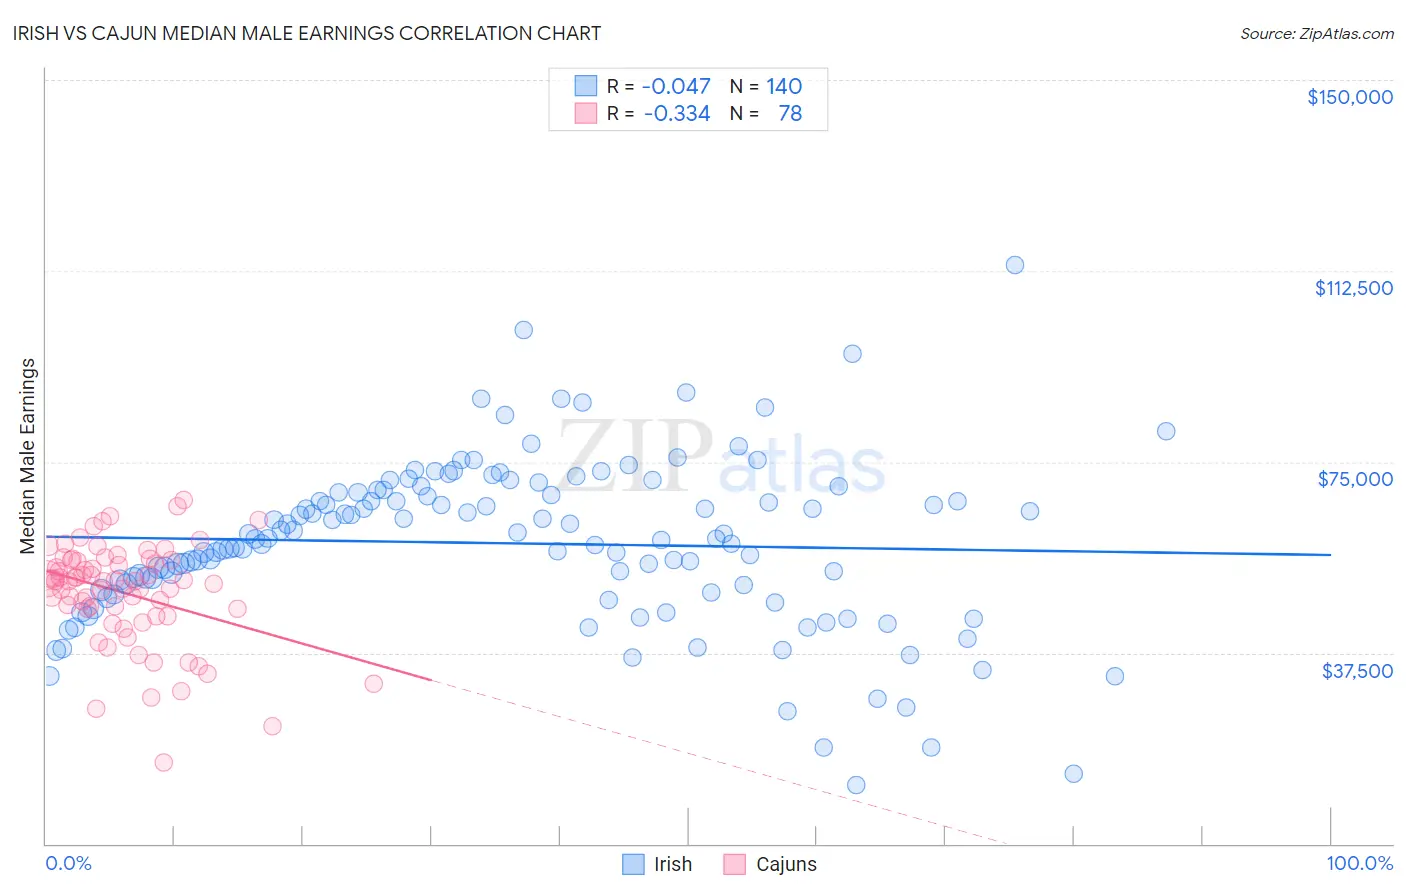
Irish vs Cajun Median Male Earnings Correlation Chart
The statistical analysis conducted on geographies consisting of 578,544,263 people shows no correlation between the proportion of Irish and median male earnings in the United States with a correlation coefficient (R) of -0.047 and weighted average of $56,464. Similarly, the statistical analysis conducted on geographies consisting of 149,660,715 people shows a mild negative correlation between the proportion of Cajuns and median male earnings in the United States with a correlation coefficient (R) of -0.334 and weighted average of $52,325, a difference of 7.9%.
Median Male Earnings Correlation Summary
| Measurement | Irish | Cajun |
| Minimum | $11,458 | $15,945 |
| Maximum | $113,788 | $67,496 |
| Range | $102,330 | $51,551 |
| Mean | $59,014 | $49,309 |
| Median | $59,889 | $51,622 |
| Interquartile 25% (IQ1) | $49,565 | $46,199 |
| Interquartile 75% (IQ3) | $68,949 | $55,757 |
| Interquartile Range (IQR) | $19,384 | $9,558 |
| Standard Deviation (Sample) | $16,409 | $9,949 |
| Standard Deviation (Population) | $16,350 | $9,885 |
Similar Demographics by Median Male Earnings
Demographics Similar to Irish by Median Male Earnings
In terms of median male earnings, the demographic groups most similar to Irish are Immigrants from Saudi Arabia ($56,452, a difference of 0.020%), Moroccan ($56,499, a difference of 0.060%), Slavic ($56,390, a difference of 0.13%), Czech ($56,546, a difference of 0.14%), and Immigrants from Germany ($56,542, a difference of 0.14%).
| Demographics | Rating | Rank | Median Male Earnings |
| Immigrants | Syria | 90.8 /100 | #128 | Exceptional $56,830 |
| Pakistanis | 89.9 /100 | #129 | Excellent $56,719 |
| Koreans | 89.4 /100 | #130 | Excellent $56,672 |
| Portuguese | 89.4 /100 | #131 | Excellent $56,663 |
| Czechs | 88.2 /100 | #132 | Excellent $56,546 |
| Immigrants | Germany | 88.2 /100 | #133 | Excellent $56,542 |
| Moroccans | 87.7 /100 | #134 | Excellent $56,499 |
| Irish | 87.4 /100 | #135 | Excellent $56,464 |
| Immigrants | Saudi Arabia | 87.2 /100 | #136 | Excellent $56,452 |
| Slavs | 86.5 /100 | #137 | Excellent $56,390 |
| Slovaks | 85.5 /100 | #138 | Excellent $56,306 |
| Zimbabweans | 85.5 /100 | #139 | Excellent $56,302 |
| Luxembourgers | 85.5 /100 | #140 | Excellent $56,300 |
| Danes | 84.8 /100 | #141 | Excellent $56,246 |
| Ethiopians | 84.8 /100 | #142 | Excellent $56,243 |
Demographics Similar to Cajuns by Median Male Earnings
In terms of median male earnings, the demographic groups most similar to Cajuns are Native Hawaiian ($52,306, a difference of 0.040%), Tlingit-Haida ($52,409, a difference of 0.16%), Delaware ($52,412, a difference of 0.17%), Bermudan ($52,465, a difference of 0.27%), and Nonimmigrants ($52,170, a difference of 0.30%).
| Demographics | Rating | Rank | Median Male Earnings |
| Immigrants | Colombia | 15.0 /100 | #205 | Poor $52,725 |
| Immigrants | Iraq | 14.5 /100 | #206 | Poor $52,681 |
| Vietnamese | 12.7 /100 | #207 | Poor $52,525 |
| Venezuelans | 12.5 /100 | #208 | Poor $52,510 |
| Bermudans | 12.1 /100 | #209 | Poor $52,465 |
| Delaware | 11.5 /100 | #210 | Poor $52,412 |
| Tlingit-Haida | 11.5 /100 | #211 | Poor $52,409 |
| Cajuns | 10.7 /100 | #212 | Poor $52,325 |
| Native Hawaiians | 10.5 /100 | #213 | Poor $52,306 |
| Immigrants | Nonimmigrants | 9.3 /100 | #214 | Tragic $52,170 |
| Immigrants | Cameroon | 8.9 /100 | #215 | Tragic $52,119 |
| Immigrants | Venezuela | 8.3 /100 | #216 | Tragic $52,041 |
| Nigerians | 8.3 /100 | #217 | Tragic $52,039 |
| Immigrants | Panama | 7.7 /100 | #218 | Tragic $51,962 |
| Immigrants | Ghana | 6.9 /100 | #219 | Tragic $51,836 |