Irish vs Lebanese Median Male Earnings
COMPARE
Irish
Lebanese
Median Male Earnings
Median Male Earnings Comparison
Irish
Lebanese
$56,464
MEDIAN MALE EARNINGS
87.4/ 100
METRIC RATING
135th/ 347
METRIC RANK
$57,409
MEDIAN MALE EARNINGS
94.6/ 100
METRIC RATING
116th/ 347
METRIC RANK
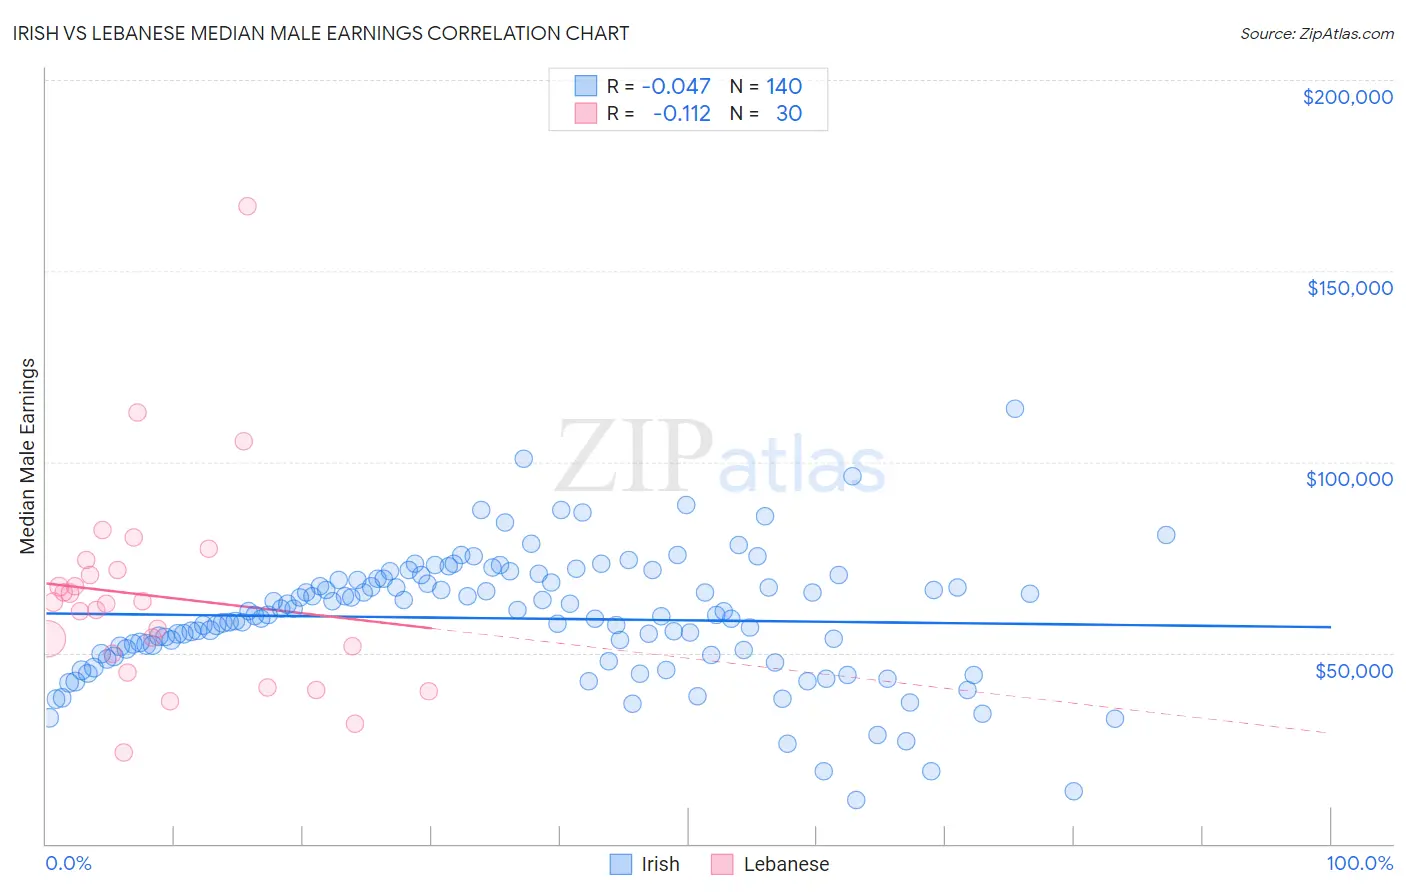
Irish vs Lebanese Median Male Earnings Correlation Chart
The statistical analysis conducted on geographies consisting of 578,544,263 people shows no correlation between the proportion of Irish and median male earnings in the United States with a correlation coefficient (R) of -0.047 and weighted average of $56,464. Similarly, the statistical analysis conducted on geographies consisting of 401,493,865 people shows a poor negative correlation between the proportion of Lebanese and median male earnings in the United States with a correlation coefficient (R) of -0.112 and weighted average of $57,409, a difference of 1.7%.
Median Male Earnings Correlation Summary
| Measurement | Irish | Lebanese |
| Minimum | $11,458 | $23,959 |
| Maximum | $113,788 | $167,014 |
| Range | $102,330 | $143,055 |
| Mean | $59,014 | $64,779 |
| Median | $59,889 | $62,976 |
| Interquartile 25% (IQ1) | $49,565 | $49,621 |
| Interquartile 75% (IQ3) | $68,949 | $71,843 |
| Interquartile Range (IQR) | $19,384 | $22,221 |
| Standard Deviation (Sample) | $16,409 | $27,382 |
| Standard Deviation (Population) | $16,350 | $26,922 |
Demographics Similar to Irish and Lebanese by Median Male Earnings
In terms of median male earnings, the demographic groups most similar to Irish are Moroccan ($56,499, a difference of 0.060%), Czech ($56,546, a difference of 0.14%), Immigrants from Germany ($56,542, a difference of 0.14%), Portuguese ($56,663, a difference of 0.35%), and Korean ($56,672, a difference of 0.37%). Similarly, the demographic groups most similar to Lebanese are Swedish ($57,445, a difference of 0.060%), Immigrants from Zimbabwe ($57,352, a difference of 0.10%), Hungarian ($57,309, a difference of 0.18%), Arab ($57,298, a difference of 0.19%), and Canadian ($57,286, a difference of 0.22%).
| Demographics | Rating | Rank | Median Male Earnings |
| Swedes | 94.8 /100 | #115 | Exceptional $57,445 |
| Lebanese | 94.6 /100 | #116 | Exceptional $57,409 |
| Immigrants | Zimbabwe | 94.3 /100 | #117 | Exceptional $57,352 |
| Hungarians | 94.0 /100 | #118 | Exceptional $57,309 |
| Arabs | 94.0 /100 | #119 | Exceptional $57,298 |
| Canadians | 93.9 /100 | #120 | Exceptional $57,286 |
| Immigrants | Albania | 93.3 /100 | #121 | Exceptional $57,179 |
| Immigrants | Jordan | 93.1 /100 | #122 | Exceptional $57,145 |
| Slovenes | 93.1 /100 | #123 | Exceptional $57,145 |
| Chileans | 91.9 /100 | #124 | Exceptional $56,973 |
| Immigrants | Morocco | 91.8 /100 | #125 | Exceptional $56,958 |
| Chinese | 91.1 /100 | #126 | Exceptional $56,872 |
| Brazilians | 90.9 /100 | #127 | Exceptional $56,837 |
| Immigrants | Syria | 90.8 /100 | #128 | Exceptional $56,830 |
| Pakistanis | 89.9 /100 | #129 | Excellent $56,719 |
| Koreans | 89.4 /100 | #130 | Excellent $56,672 |
| Portuguese | 89.4 /100 | #131 | Excellent $56,663 |
| Czechs | 88.2 /100 | #132 | Excellent $56,546 |
| Immigrants | Germany | 88.2 /100 | #133 | Excellent $56,542 |
| Moroccans | 87.7 /100 | #134 | Excellent $56,499 |
| Irish | 87.4 /100 | #135 | Excellent $56,464 |