Irish vs Albanian Median Female Earnings
COMPARE
Irish
Albanian
Median Female Earnings
Median Female Earnings Comparison
Irish
Albanians
$39,291
MEDIAN FEMALE EARNINGS
30.0/ 100
METRIC RATING
194th/ 347
METRIC RANK
$42,584
MEDIAN FEMALE EARNINGS
99.8/ 100
METRIC RATING
72nd/ 347
METRIC RANK
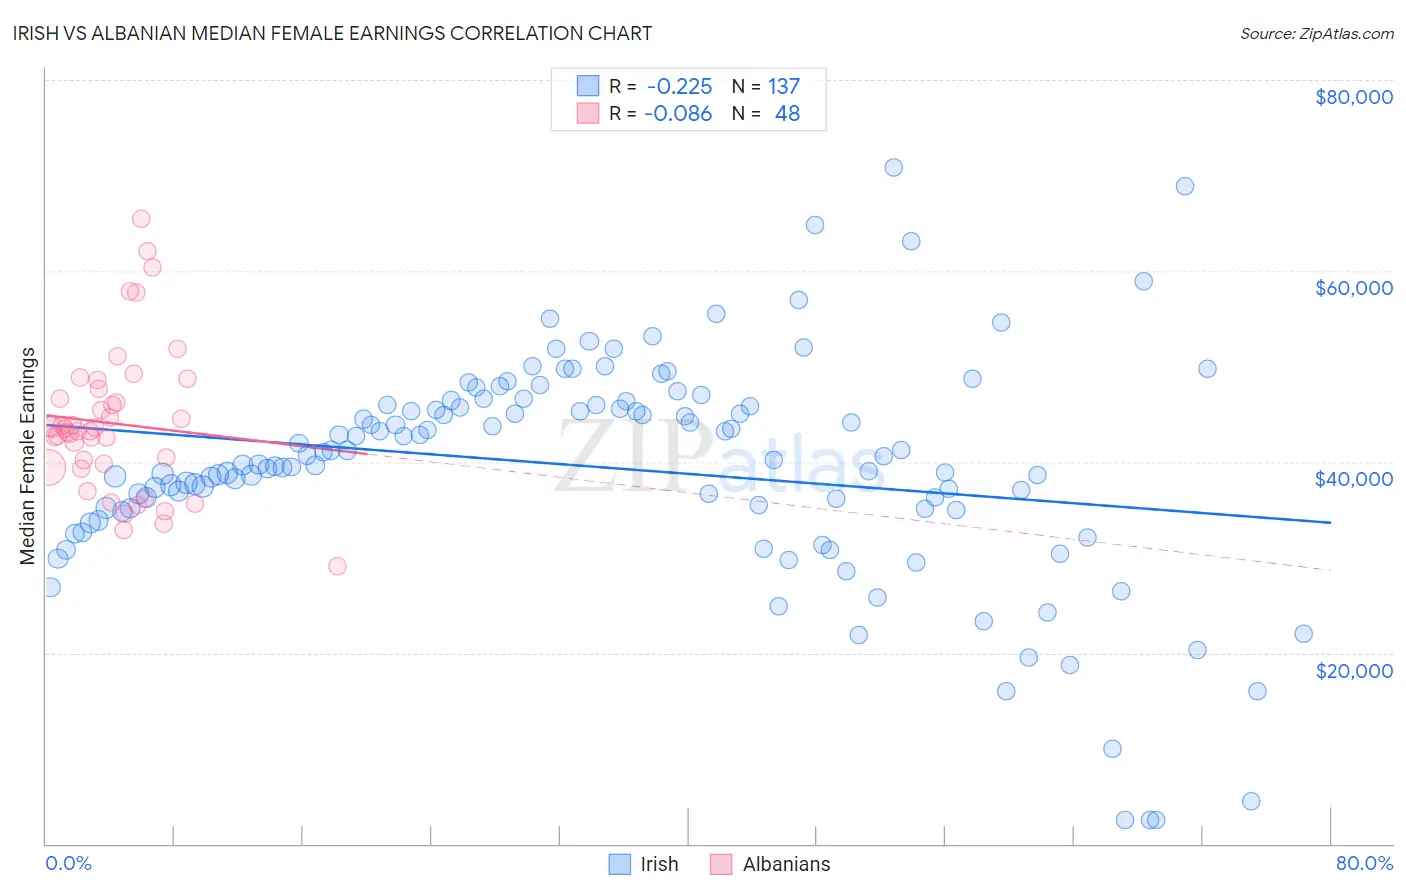
Irish vs Albanian Median Female Earnings Correlation Chart
The statistical analysis conducted on geographies consisting of 577,855,613 people shows a weak negative correlation between the proportion of Irish and median female earnings in the United States with a correlation coefficient (R) of -0.225 and weighted average of $39,291. Similarly, the statistical analysis conducted on geographies consisting of 193,224,752 people shows a slight negative correlation between the proportion of Albanians and median female earnings in the United States with a correlation coefficient (R) of -0.086 and weighted average of $42,584, a difference of 8.4%.
Median Female Earnings Correlation Summary
| Measurement | Irish | Albanian |
| Minimum | $2,499 | $29,043 |
| Maximum | $70,827 | $65,406 |
| Range | $68,328 | $36,363 |
| Mean | $39,404 | $44,026 |
| Median | $40,229 | $43,361 |
| Interquartile 25% (IQ1) | $35,070 | $39,614 |
| Interquartile 75% (IQ3) | $45,938 | $47,094 |
| Interquartile Range (IQR) | $10,868 | $7,480 |
| Standard Deviation (Sample) | $11,843 | $7,618 |
| Standard Deviation (Population) | $11,799 | $7,538 |
Similar Demographics by Median Female Earnings
Demographics Similar to Irish by Median Female Earnings
In terms of median female earnings, the demographic groups most similar to Irish are Immigrants from Nigeria ($39,294, a difference of 0.010%), Immigrants ($39,328, a difference of 0.090%), Immigrants from Western Africa ($39,351, a difference of 0.15%), Uruguayan ($39,228, a difference of 0.16%), and Puget Sound Salish ($39,376, a difference of 0.22%).
| Demographics | Rating | Rank | Median Female Earnings |
| Swedes | 36.0 /100 | #187 | Fair $39,421 |
| Bermudans | 35.9 /100 | #188 | Fair $39,418 |
| Senegalese | 34.2 /100 | #189 | Fair $39,384 |
| Puget Sound Salish | 33.9 /100 | #190 | Fair $39,376 |
| Immigrants | Western Africa | 32.7 /100 | #191 | Fair $39,351 |
| Immigrants | Immigrants | 31.7 /100 | #192 | Fair $39,328 |
| Immigrants | Nigeria | 30.2 /100 | #193 | Fair $39,294 |
| Irish | 30.0 /100 | #194 | Fair $39,291 |
| Uruguayans | 27.3 /100 | #195 | Fair $39,228 |
| Immigrants | Costa Rica | 25.6 /100 | #196 | Fair $39,186 |
| Assyrians/Chaldeans/Syriacs | 24.6 /100 | #197 | Fair $39,159 |
| Ecuadorians | 23.0 /100 | #198 | Fair $39,117 |
| Icelanders | 22.7 /100 | #199 | Fair $39,109 |
| Immigrants | Panama | 20.6 /100 | #200 | Fair $39,049 |
| Panamanians | 20.6 /100 | #201 | Fair $39,049 |
Demographics Similar to Albanians by Median Female Earnings
In terms of median female earnings, the demographic groups most similar to Albanians are Mongolian ($42,542, a difference of 0.10%), Immigrants from South Africa ($42,508, a difference of 0.18%), Immigrants from Romania ($42,718, a difference of 0.32%), New Zealander ($42,446, a difference of 0.32%), and Immigrants from Italy ($42,446, a difference of 0.33%).
| Demographics | Rating | Rank | Median Female Earnings |
| Sierra Leoneans | 99.9 /100 | #65 | Exceptional $42,868 |
| Immigrants | Norway | 99.9 /100 | #66 | Exceptional $42,837 |
| Immigrants | Egypt | 99.9 /100 | #67 | Exceptional $42,837 |
| Immigrants | Austria | 99.8 /100 | #68 | Exceptional $42,824 |
| Immigrants | Spain | 99.8 /100 | #69 | Exceptional $42,815 |
| Immigrants | Ethiopia | 99.8 /100 | #70 | Exceptional $42,744 |
| Immigrants | Romania | 99.8 /100 | #71 | Exceptional $42,718 |
| Albanians | 99.8 /100 | #72 | Exceptional $42,584 |
| Mongolians | 99.7 /100 | #73 | Exceptional $42,542 |
| Immigrants | South Africa | 99.7 /100 | #74 | Exceptional $42,508 |
| New Zealanders | 99.7 /100 | #75 | Exceptional $42,446 |
| Immigrants | Italy | 99.7 /100 | #76 | Exceptional $42,446 |
| Immigrants | Albania | 99.6 /100 | #77 | Exceptional $42,388 |
| Immigrants | Kazakhstan | 99.6 /100 | #78 | Exceptional $42,386 |
| Greeks | 99.6 /100 | #79 | Exceptional $42,336 |