Iraqi vs Immigrants from Ethiopia Median Household Income
COMPARE
Iraqi
Immigrants from Ethiopia
Median Household Income
Median Household Income Comparison
Iraqis
Immigrants from Ethiopia
$83,753
MEDIAN HOUSEHOLD INCOME
29.6/ 100
METRIC RATING
191st/ 347
METRIC RANK
$88,687
MEDIAN HOUSEHOLD INCOME
90.9/ 100
METRIC RATING
133rd/ 347
METRIC RANK
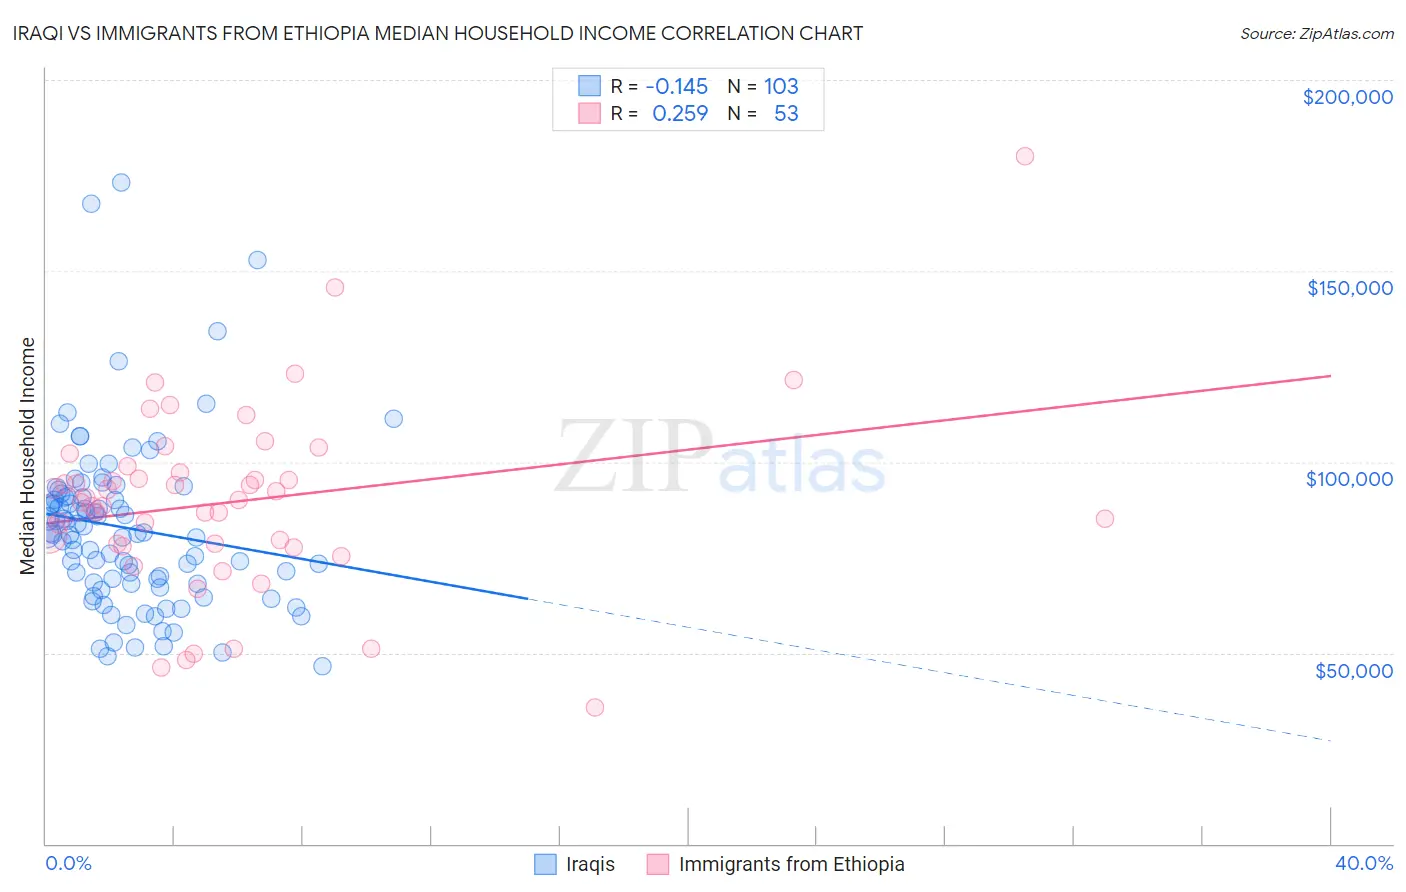
Iraqi vs Immigrants from Ethiopia Median Household Income Correlation Chart
The statistical analysis conducted on geographies consisting of 170,587,047 people shows a poor negative correlation between the proportion of Iraqis and median household income in the United States with a correlation coefficient (R) of -0.145 and weighted average of $83,753. Similarly, the statistical analysis conducted on geographies consisting of 211,436,017 people shows a weak positive correlation between the proportion of Immigrants from Ethiopia and median household income in the United States with a correlation coefficient (R) of 0.259 and weighted average of $88,687, a difference of 5.9%.
Median Household Income Correlation Summary
| Measurement | Iraqi | Immigrants from Ethiopia |
| Minimum | $46,565 | $35,809 |
| Maximum | $173,015 | $180,167 |
| Range | $126,450 | $144,358 |
| Mean | $82,738 | $89,607 |
| Median | $81,250 | $90,025 |
| Interquartile 25% (IQ1) | $68,093 | $78,327 |
| Interquartile 75% (IQ3) | $91,098 | $98,118 |
| Interquartile Range (IQR) | $23,005 | $19,791 |
| Standard Deviation (Sample) | $22,309 | $24,432 |
| Standard Deviation (Population) | $22,201 | $24,200 |
Similar Demographics by Median Household Income
Demographics Similar to Iraqis by Median Household Income
In terms of median household income, the demographic groups most similar to Iraqis are Slovak ($83,798, a difference of 0.050%), Welsh ($83,628, a difference of 0.15%), Immigrants from Colombia ($83,902, a difference of 0.18%), Finnish ($83,607, a difference of 0.18%), and Ghanaian ($83,582, a difference of 0.21%).
| Demographics | Rating | Rank | Median Household Income |
| Immigrants | Eastern Africa | 37.4 /100 | #184 | Fair $84,299 |
| Kenyans | 34.2 /100 | #185 | Fair $84,085 |
| Puget Sound Salish | 33.2 /100 | #186 | Fair $84,011 |
| Belgians | 33.2 /100 | #187 | Fair $84,008 |
| Tlingit-Haida | 32.6 /100 | #188 | Fair $83,968 |
| Immigrants | Colombia | 31.7 /100 | #189 | Fair $83,902 |
| Slovaks | 30.2 /100 | #190 | Fair $83,798 |
| Iraqis | 29.6 /100 | #191 | Fair $83,753 |
| Welsh | 28.0 /100 | #192 | Fair $83,628 |
| Finns | 27.7 /100 | #193 | Fair $83,607 |
| Ghanaians | 27.4 /100 | #194 | Fair $83,582 |
| Immigrants | Armenia | 27.0 /100 | #195 | Fair $83,555 |
| French | 26.0 /100 | #196 | Fair $83,468 |
| Aleuts | 25.7 /100 | #197 | Fair $83,446 |
| Japanese | 25.1 /100 | #198 | Fair $83,395 |
Demographics Similar to Immigrants from Ethiopia by Median Household Income
In terms of median household income, the demographic groups most similar to Immigrants from Ethiopia are European ($88,751, a difference of 0.070%), Immigrants from Syria ($88,792, a difference of 0.12%), Swedish ($88,524, a difference of 0.18%), Immigrants from Sierra Leone ($88,498, a difference of 0.21%), and Polish ($88,472, a difference of 0.24%).
| Demographics | Rating | Rank | Median Household Income |
| Immigrants | Oceania | 92.9 /100 | #126 | Exceptional $89,100 |
| Immigrants | Peru | 92.5 /100 | #127 | Exceptional $89,010 |
| Portuguese | 92.3 /100 | #128 | Exceptional $88,976 |
| Brazilians | 92.1 /100 | #129 | Exceptional $88,934 |
| British | 92.0 /100 | #130 | Exceptional $88,914 |
| Immigrants | Syria | 91.4 /100 | #131 | Exceptional $88,792 |
| Europeans | 91.2 /100 | #132 | Exceptional $88,751 |
| Immigrants | Ethiopia | 90.9 /100 | #133 | Exceptional $88,687 |
| Swedes | 90.0 /100 | #134 | Exceptional $88,524 |
| Immigrants | Sierra Leone | 89.9 /100 | #135 | Excellent $88,498 |
| Poles | 89.7 /100 | #136 | Excellent $88,472 |
| Sierra Leoneans | 89.6 /100 | #137 | Excellent $88,463 |
| Arabs | 89.2 /100 | #138 | Excellent $88,398 |
| Immigrants | Chile | 89.2 /100 | #139 | Excellent $88,388 |
| Lebanese | 87.2 /100 | #140 | Excellent $88,091 |