Iraqi vs Immigrants from Jamaica 3rd Grade
COMPARE
Iraqi
Immigrants from Jamaica
3rd Grade
3rd Grade Comparison
Iraqis
Immigrants from Jamaica
97.5%
3RD GRADE
6.9/ 100
METRIC RATING
215th/ 347
METRIC RANK
97.3%
3RD GRADE
0.3/ 100
METRIC RATING
265th/ 347
METRIC RANK
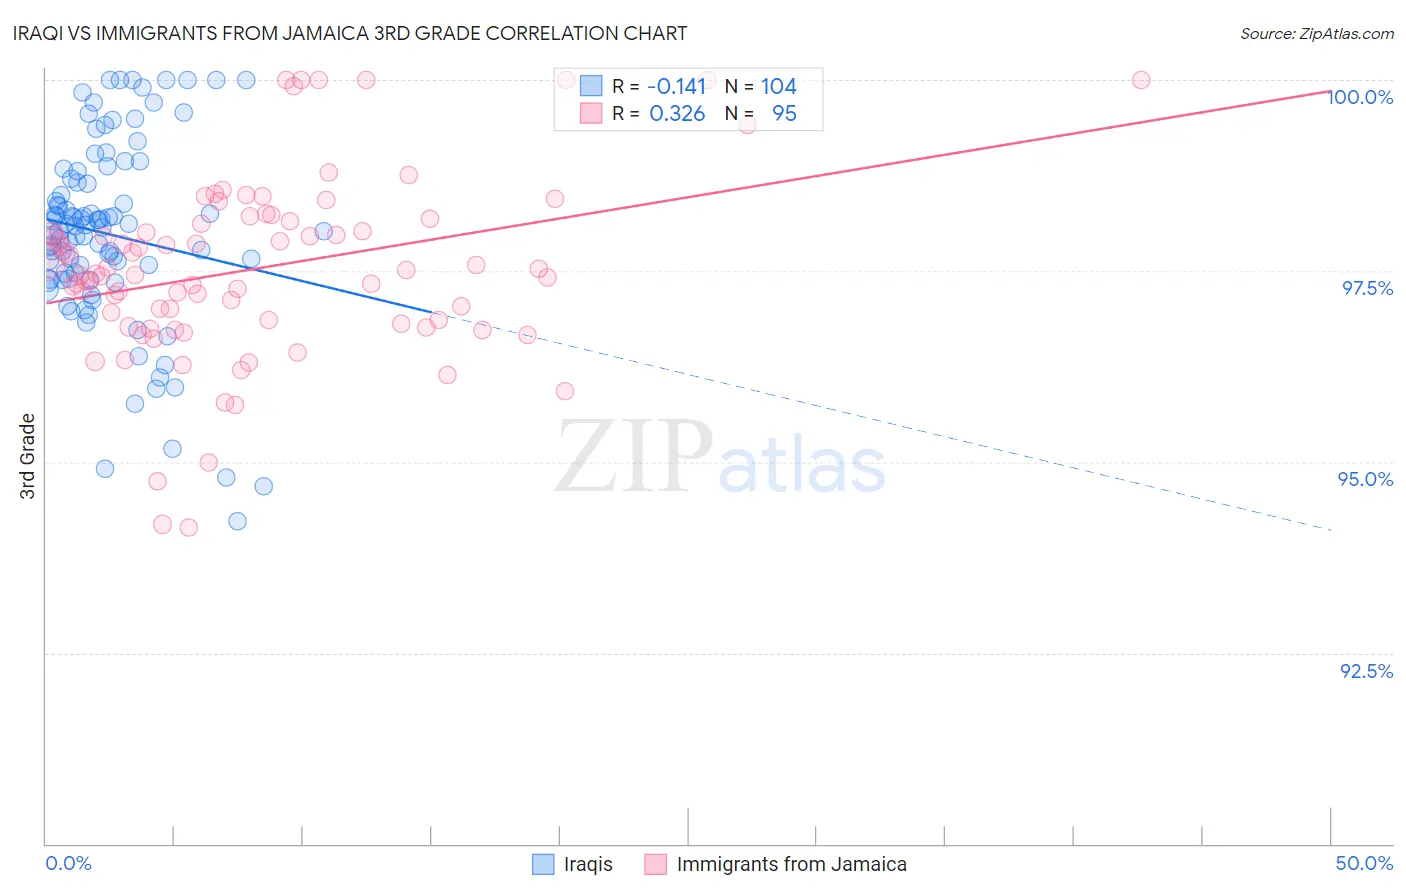
Iraqi vs Immigrants from Jamaica 3rd Grade Correlation Chart
The statistical analysis conducted on geographies consisting of 170,561,413 people shows a poor negative correlation between the proportion of Iraqis and percentage of population with at least 3rd grade education in the United States with a correlation coefficient (R) of -0.141 and weighted average of 97.5%. Similarly, the statistical analysis conducted on geographies consisting of 301,829,538 people shows a mild positive correlation between the proportion of Immigrants from Jamaica and percentage of population with at least 3rd grade education in the United States with a correlation coefficient (R) of 0.326 and weighted average of 97.3%, a difference of 0.28%.
3rd Grade Correlation Summary
| Measurement | Iraqi | Immigrants from Jamaica |
| Minimum | 94.2% | 94.1% |
| Maximum | 100.0% | 100.0% |
| Range | 5.8% | 5.9% |
| Mean | 98.0% | 97.5% |
| Median | 98.1% | 97.5% |
| Interquartile 25% (IQ1) | 97.4% | 96.8% |
| Interquartile 75% (IQ3) | 98.7% | 98.1% |
| Interquartile Range (IQR) | 1.3% | 1.3% |
| Standard Deviation (Sample) | 1.2% | 1.2% |
| Standard Deviation (Population) | 1.2% | 1.2% |
Similar Demographics by 3rd Grade
Demographics Similar to Iraqis by 3rd Grade
In terms of 3rd grade, the demographic groups most similar to Iraqis are Samoan (97.5%, a difference of 0.0%), Immigrants from Bahamas (97.6%, a difference of 0.020%), Moroccan (97.6%, a difference of 0.020%), Yuman (97.6%, a difference of 0.020%), and South American Indian (97.5%, a difference of 0.020%).
| Demographics | Rating | Rank | 3rd Grade |
| Immigrants | Zaire | 11.9 /100 | #208 | Poor 97.6% |
| Costa Ricans | 9.6 /100 | #209 | Tragic 97.6% |
| Immigrants | Oceania | 9.5 /100 | #210 | Tragic 97.6% |
| Laotians | 9.4 /100 | #211 | Tragic 97.6% |
| Immigrants | Bahamas | 8.5 /100 | #212 | Tragic 97.6% |
| Moroccans | 8.5 /100 | #213 | Tragic 97.6% |
| Yuman | 8.4 /100 | #214 | Tragic 97.6% |
| Iraqis | 6.9 /100 | #215 | Tragic 97.5% |
| Samoans | 6.9 /100 | #216 | Tragic 97.5% |
| South American Indians | 5.7 /100 | #217 | Tragic 97.5% |
| Immigrants | Nepal | 5.3 /100 | #218 | Tragic 97.5% |
| Immigrants | Panama | 5.2 /100 | #219 | Tragic 97.5% |
| Immigrants | Morocco | 5.0 /100 | #220 | Tragic 97.5% |
| Uruguayans | 5.0 /100 | #221 | Tragic 97.5% |
| Sierra Leoneans | 4.6 /100 | #222 | Tragic 97.5% |
Demographics Similar to Immigrants from Jamaica by 3rd Grade
In terms of 3rd grade, the demographic groups most similar to Immigrants from Jamaica are Taiwanese (97.3%, a difference of 0.010%), West Indian (97.3%, a difference of 0.010%), Yaqui (97.3%, a difference of 0.010%), Immigrants from Nigeria (97.3%, a difference of 0.010%), and Immigrants from South America (97.3%, a difference of 0.020%).
| Demographics | Rating | Rank | 3rd Grade |
| Immigrants | Liberia | 0.5 /100 | #258 | Tragic 97.3% |
| Armenians | 0.4 /100 | #259 | Tragic 97.3% |
| Immigrants | Ethiopia | 0.4 /100 | #260 | Tragic 97.3% |
| Immigrants | South America | 0.4 /100 | #261 | Tragic 97.3% |
| Immigrants | Sierra Leone | 0.4 /100 | #262 | Tragic 97.3% |
| Taiwanese | 0.3 /100 | #263 | Tragic 97.3% |
| West Indians | 0.3 /100 | #264 | Tragic 97.3% |
| Immigrants | Jamaica | 0.3 /100 | #265 | Tragic 97.3% |
| Yaqui | 0.3 /100 | #266 | Tragic 97.3% |
| Immigrants | Nigeria | 0.3 /100 | #267 | Tragic 97.3% |
| Cubans | 0.2 /100 | #268 | Tragic 97.3% |
| Fijians | 0.2 /100 | #269 | Tragic 97.3% |
| Immigrants | China | 0.2 /100 | #270 | Tragic 97.2% |
| Puerto Ricans | 0.2 /100 | #271 | Tragic 97.2% |
| Ghanaians | 0.1 /100 | #272 | Tragic 97.2% |