Immigrants from Western Africa vs French American Indian Median Female Earnings
COMPARE
Immigrants from Western Africa
French American Indian
Median Female Earnings
Median Female Earnings Comparison
Immigrants from Western Africa
French American Indians
$39,351
MEDIAN FEMALE EARNINGS
32.7/ 100
METRIC RATING
191st/ 347
METRIC RANK
$36,920
MEDIAN FEMALE EARNINGS
0.3/ 100
METRIC RATING
270th/ 347
METRIC RANK
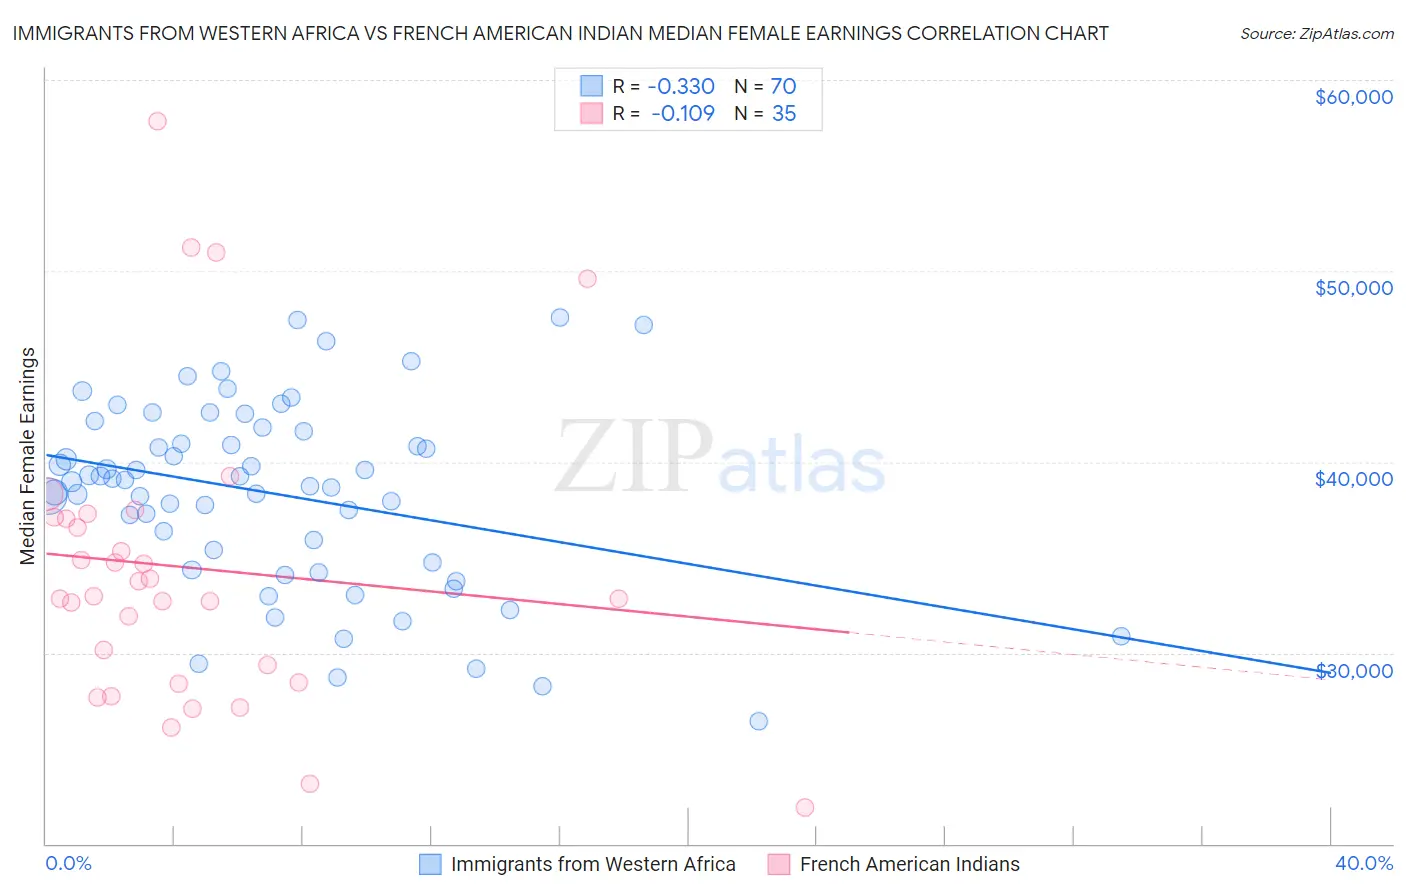
Immigrants from Western Africa vs French American Indian Median Female Earnings Correlation Chart
The statistical analysis conducted on geographies consisting of 357,790,010 people shows a mild negative correlation between the proportion of Immigrants from Western Africa and median female earnings in the United States with a correlation coefficient (R) of -0.330 and weighted average of $39,351. Similarly, the statistical analysis conducted on geographies consisting of 131,945,906 people shows a poor negative correlation between the proportion of French American Indians and median female earnings in the United States with a correlation coefficient (R) of -0.109 and weighted average of $36,920, a difference of 6.6%.
Median Female Earnings Correlation Summary
| Measurement | Immigrants from Western Africa | French American Indian |
| Minimum | $26,446 | $21,875 |
| Maximum | $47,567 | $57,813 |
| Range | $21,121 | $35,938 |
| Mean | $38,325 | $34,449 |
| Median | $39,007 | $32,961 |
| Interquartile 25% (IQ1) | $34,756 | $28,438 |
| Interquartile 75% (IQ3) | $41,620 | $37,095 |
| Interquartile Range (IQR) | $6,864 | $8,657 |
| Standard Deviation (Sample) | $4,866 | $7,858 |
| Standard Deviation (Population) | $4,831 | $7,745 |
Similar Demographics by Median Female Earnings
Demographics Similar to Immigrants from Western Africa by Median Female Earnings
In terms of median female earnings, the demographic groups most similar to Immigrants from Western Africa are Puget Sound Salish ($39,376, a difference of 0.060%), Immigrants ($39,328, a difference of 0.060%), Senegalese ($39,384, a difference of 0.080%), Immigrants from Nigeria ($39,294, a difference of 0.14%), and Irish ($39,291, a difference of 0.15%).
| Demographics | Rating | Rank | Median Female Earnings |
| Europeans | 37.7 /100 | #184 | Fair $39,457 |
| Immigrants | West Indies | 36.9 /100 | #185 | Fair $39,441 |
| Colombians | 36.9 /100 | #186 | Fair $39,439 |
| Swedes | 36.0 /100 | #187 | Fair $39,421 |
| Bermudans | 35.9 /100 | #188 | Fair $39,418 |
| Senegalese | 34.2 /100 | #189 | Fair $39,384 |
| Puget Sound Salish | 33.9 /100 | #190 | Fair $39,376 |
| Immigrants | Western Africa | 32.7 /100 | #191 | Fair $39,351 |
| Immigrants | Immigrants | 31.7 /100 | #192 | Fair $39,328 |
| Immigrants | Nigeria | 30.2 /100 | #193 | Fair $39,294 |
| Irish | 30.0 /100 | #194 | Fair $39,291 |
| Uruguayans | 27.3 /100 | #195 | Fair $39,228 |
| Immigrants | Costa Rica | 25.6 /100 | #196 | Fair $39,186 |
| Assyrians/Chaldeans/Syriacs | 24.6 /100 | #197 | Fair $39,159 |
| Ecuadorians | 23.0 /100 | #198 | Fair $39,117 |
Demographics Similar to French American Indians by Median Female Earnings
In terms of median female earnings, the demographic groups most similar to French American Indians are Nicaraguan ($36,904, a difference of 0.040%), Immigrants from Dominican Republic ($36,857, a difference of 0.17%), Immigrants from Laos ($36,841, a difference of 0.21%), Immigrants from Venezuela ($37,003, a difference of 0.23%), and Cree ($37,018, a difference of 0.27%).
| Demographics | Rating | Rank | Median Female Earnings |
| German Russians | 0.5 /100 | #263 | Tragic $37,105 |
| Salvadorans | 0.4 /100 | #264 | Tragic $37,083 |
| Immigrants | Belize | 0.4 /100 | #265 | Tragic $37,056 |
| Dominicans | 0.4 /100 | #266 | Tragic $37,046 |
| Immigrants | Nonimmigrants | 0.4 /100 | #267 | Tragic $37,024 |
| Cree | 0.4 /100 | #268 | Tragic $37,018 |
| Immigrants | Venezuela | 0.4 /100 | #269 | Tragic $37,003 |
| French American Indians | 0.3 /100 | #270 | Tragic $36,920 |
| Nicaraguans | 0.3 /100 | #271 | Tragic $36,904 |
| Immigrants | Dominican Republic | 0.3 /100 | #272 | Tragic $36,857 |
| Immigrants | Laos | 0.3 /100 | #273 | Tragic $36,841 |
| Immigrants | El Salvador | 0.2 /100 | #274 | Tragic $36,673 |
| Africans | 0.1 /100 | #275 | Tragic $36,530 |
| Central Americans | 0.1 /100 | #276 | Tragic $36,492 |
| Marshallese | 0.1 /100 | #277 | Tragic $36,459 |