Immigrants from Dominica vs French American Indian Median Female Earnings
COMPARE
Immigrants from Dominica
French American Indian
Median Female Earnings
Median Female Earnings Comparison
Immigrants from Dominica
French American Indians
$37,825
MEDIAN FEMALE EARNINGS
2.0/ 100
METRIC RATING
252nd/ 347
METRIC RANK
$36,920
MEDIAN FEMALE EARNINGS
0.3/ 100
METRIC RATING
270th/ 347
METRIC RANK
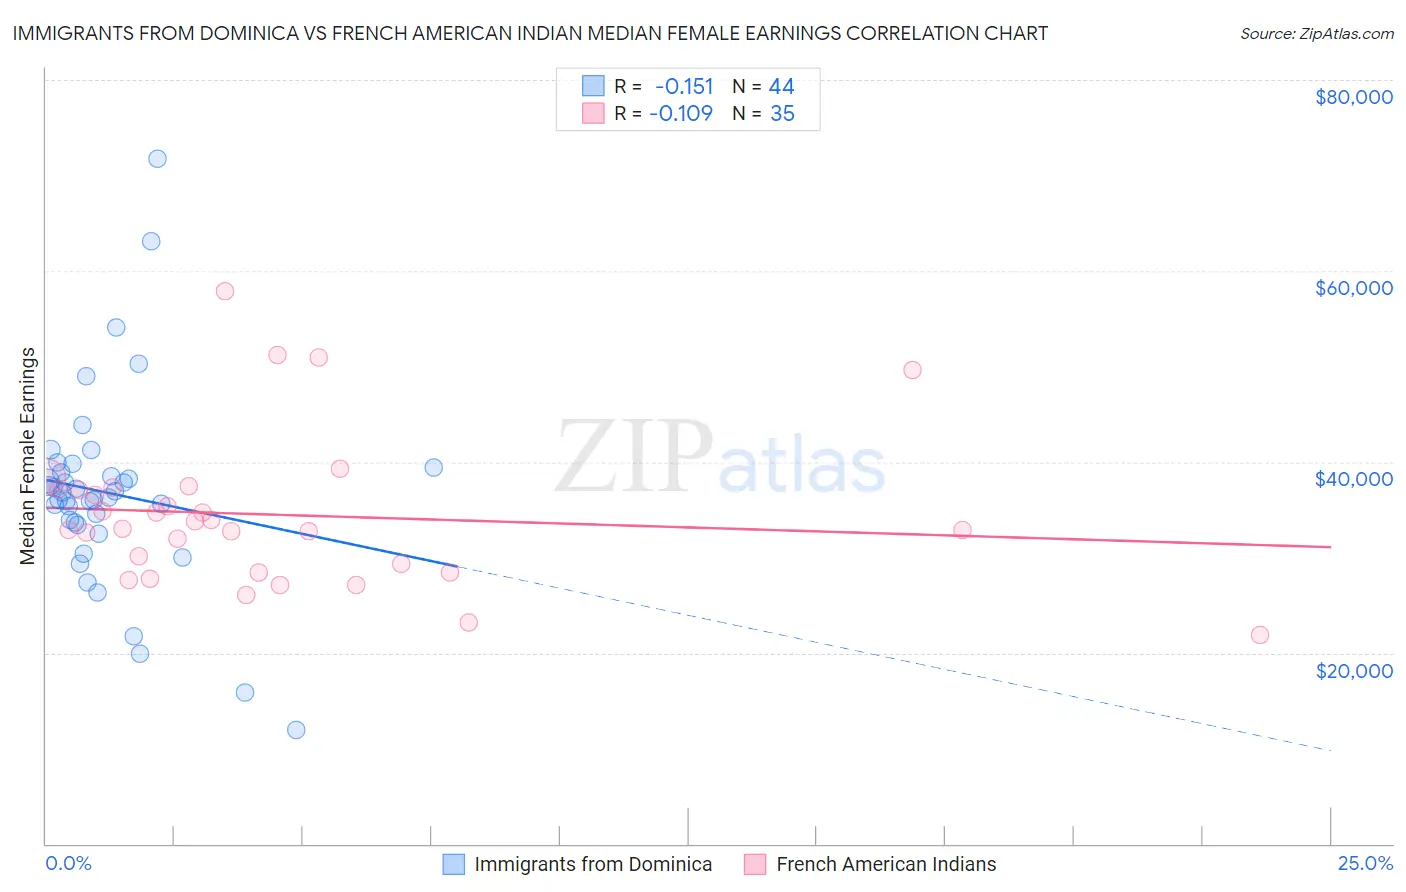
Immigrants from Dominica vs French American Indian Median Female Earnings Correlation Chart
The statistical analysis conducted on geographies consisting of 83,795,110 people shows a poor negative correlation between the proportion of Immigrants from Dominica and median female earnings in the United States with a correlation coefficient (R) of -0.151 and weighted average of $37,825. Similarly, the statistical analysis conducted on geographies consisting of 131,945,906 people shows a poor negative correlation between the proportion of French American Indians and median female earnings in the United States with a correlation coefficient (R) of -0.109 and weighted average of $36,920, a difference of 2.5%.
Median Female Earnings Correlation Summary
| Measurement | Immigrants from Dominica | French American Indian |
| Minimum | $11,953 | $21,875 |
| Maximum | $71,750 | $57,813 |
| Range | $59,797 | $35,938 |
| Mean | $36,730 | $34,449 |
| Median | $36,530 | $32,961 |
| Interquartile 25% (IQ1) | $33,522 | $28,438 |
| Interquartile 75% (IQ3) | $39,104 | $37,095 |
| Interquartile Range (IQR) | $5,583 | $8,657 |
| Standard Deviation (Sample) | $10,397 | $7,858 |
| Standard Deviation (Population) | $10,278 | $7,745 |
Demographics Similar to Immigrants from Dominica and French American Indians by Median Female Earnings
In terms of median female earnings, the demographic groups most similar to Immigrants from Dominica are Welsh ($37,856, a difference of 0.080%), Danish ($37,730, a difference of 0.25%), White/Caucasian ($37,531, a difference of 0.79%), Colville ($37,514, a difference of 0.83%), and Samoan ($37,498, a difference of 0.87%). Similarly, the demographic groups most similar to French American Indians are Nicaraguan ($36,904, a difference of 0.040%), Immigrants from Venezuela ($37,003, a difference of 0.23%), Cree ($37,018, a difference of 0.27%), Nonimmigrants ($37,024, a difference of 0.28%), and Dominican ($37,046, a difference of 0.34%).
| Demographics | Rating | Rank | Median Female Earnings |
| Welsh | 2.1 /100 | #251 | Tragic $37,856 |
| Immigrants | Dominica | 2.0 /100 | #252 | Tragic $37,825 |
| Danes | 1.6 /100 | #253 | Tragic $37,730 |
| Whites/Caucasians | 1.1 /100 | #254 | Tragic $37,531 |
| Colville | 1.1 /100 | #255 | Tragic $37,514 |
| Samoans | 1.0 /100 | #256 | Tragic $37,498 |
| Hawaiians | 1.0 /100 | #257 | Tragic $37,497 |
| Belizeans | 0.9 /100 | #258 | Tragic $37,429 |
| Scotch-Irish | 0.8 /100 | #259 | Tragic $37,383 |
| Dutch | 0.7 /100 | #260 | Tragic $37,339 |
| Malaysians | 0.7 /100 | #261 | Tragic $37,298 |
| Venezuelans | 0.7 /100 | #262 | Tragic $37,282 |
| German Russians | 0.5 /100 | #263 | Tragic $37,105 |
| Salvadorans | 0.4 /100 | #264 | Tragic $37,083 |
| Immigrants | Belize | 0.4 /100 | #265 | Tragic $37,056 |
| Dominicans | 0.4 /100 | #266 | Tragic $37,046 |
| Immigrants | Nonimmigrants | 0.4 /100 | #267 | Tragic $37,024 |
| Cree | 0.4 /100 | #268 | Tragic $37,018 |
| Immigrants | Venezuela | 0.4 /100 | #269 | Tragic $37,003 |
| French American Indians | 0.3 /100 | #270 | Tragic $36,920 |
| Nicaraguans | 0.3 /100 | #271 | Tragic $36,904 |