Inupiat vs Comanche Householder Income Ages 45 - 64 years
COMPARE
Inupiat
Comanche
Householder Income Ages 45 - 64 years
Householder Income Ages 45 - 64 years Comparison
Inupiat
Comanche
$91,355
HOUSEHOLDER INCOME AGES 45 - 64 YEARS
1.1/ 100
METRIC RATING
242nd/ 347
METRIC RANK
$85,787
HOUSEHOLDER INCOME AGES 45 - 64 YEARS
0.1/ 100
METRIC RATING
293rd/ 347
METRIC RANK
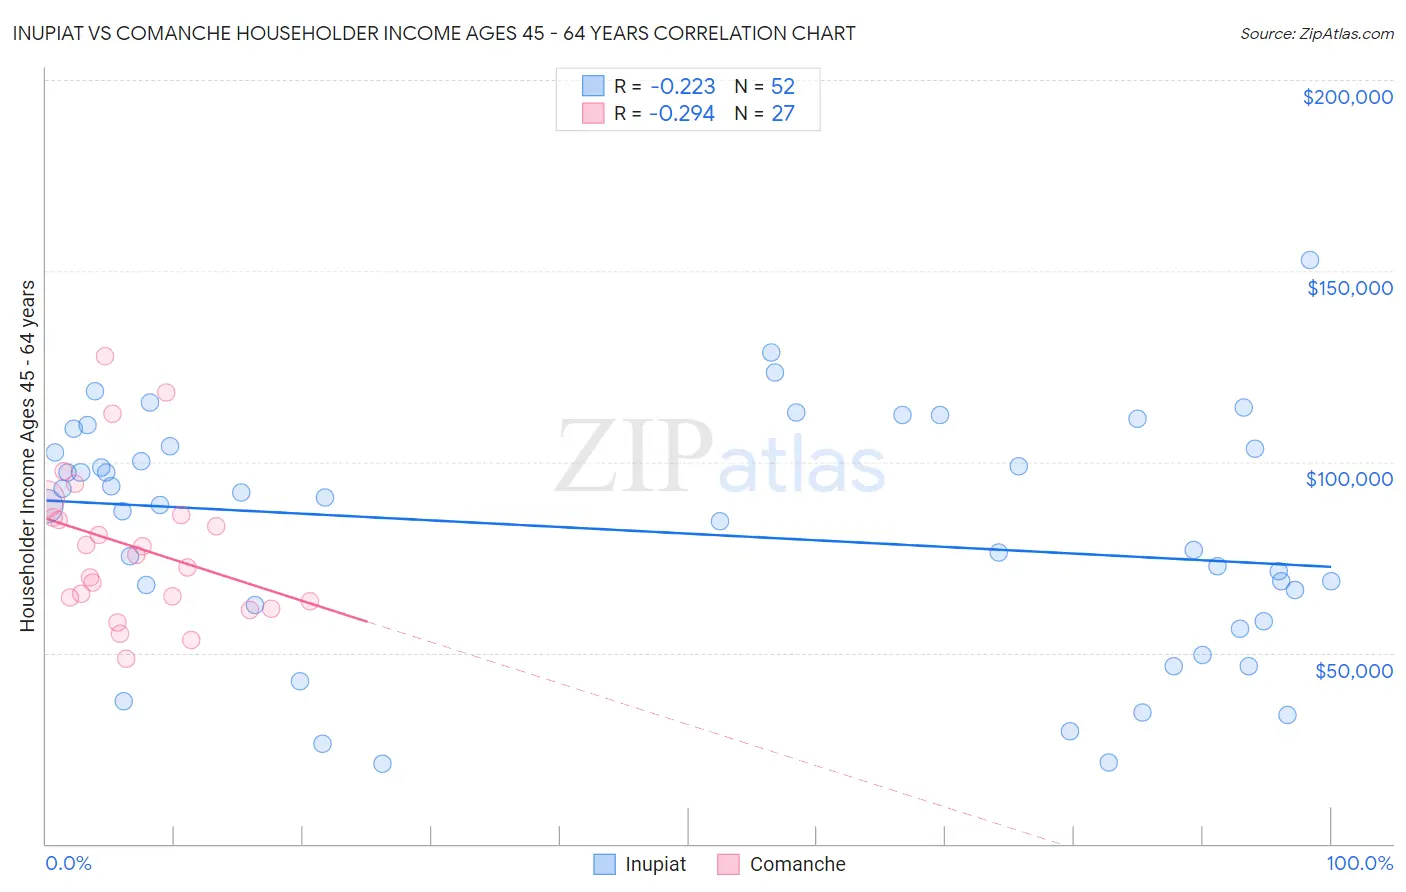
Inupiat vs Comanche Householder Income Ages 45 - 64 years Correlation Chart
The statistical analysis conducted on geographies consisting of 96,273,732 people shows a weak negative correlation between the proportion of Inupiat and household income with householder between the ages 45 and 64 in the United States with a correlation coefficient (R) of -0.223 and weighted average of $91,355. Similarly, the statistical analysis conducted on geographies consisting of 109,696,818 people shows a weak negative correlation between the proportion of Comanche and household income with householder between the ages 45 and 64 in the United States with a correlation coefficient (R) of -0.294 and weighted average of $85,787, a difference of 6.5%.
Householder Income Ages 45 - 64 years Correlation Summary
| Measurement | Inupiat | Comanche |
| Minimum | $20,833 | $48,474 |
| Maximum | $152,917 | $127,559 |
| Range | $132,084 | $79,085 |
| Mean | $81,669 | $77,729 |
| Median | $88,444 | $75,610 |
| Interquartile 25% (IQ1) | $60,416 | $63,523 |
| Interquartile 75% (IQ3) | $103,725 | $86,210 |
| Interquartile Range (IQR) | $43,309 | $22,687 |
| Standard Deviation (Sample) | $30,923 | $19,770 |
| Standard Deviation (Population) | $30,625 | $19,400 |
Similar Demographics by Householder Income Ages 45 - 64 years
Demographics Similar to Inupiat by Householder Income Ages 45 - 64 years
In terms of householder income ages 45 - 64 years, the demographic groups most similar to Inupiat are Trinidadian and Tobagonian ($91,357, a difference of 0.0%), Immigrants from Trinidad and Tobago ($91,347, a difference of 0.010%), Immigrants from Burma/Myanmar ($91,385, a difference of 0.030%), Immigrants from Middle Africa ($91,293, a difference of 0.070%), and Immigrants from Ecuador ($91,462, a difference of 0.12%).
| Demographics | Rating | Rank | Householder Income Ages 45 - 64 years |
| Nicaraguans | 2.0 /100 | #235 | Tragic $92,554 |
| Immigrants | Western Africa | 1.8 /100 | #236 | Tragic $92,384 |
| Immigrants | Bangladesh | 1.7 /100 | #237 | Tragic $92,208 |
| Pennsylvania Germans | 1.5 /100 | #238 | Tragic $91,956 |
| Immigrants | Ecuador | 1.2 /100 | #239 | Tragic $91,462 |
| Immigrants | Burma/Myanmar | 1.1 /100 | #240 | Tragic $91,385 |
| Trinidadians and Tobagonians | 1.1 /100 | #241 | Tragic $91,357 |
| Inupiat | 1.1 /100 | #242 | Tragic $91,355 |
| Immigrants | Trinidad and Tobago | 1.1 /100 | #243 | Tragic $91,347 |
| Immigrants | Middle Africa | 1.1 /100 | #244 | Tragic $91,293 |
| Guyanese | 0.9 /100 | #245 | Tragic $90,966 |
| Central Americans | 0.9 /100 | #246 | Tragic $90,951 |
| Alaskan Athabascans | 0.9 /100 | #247 | Tragic $90,951 |
| Immigrants | Laos | 0.9 /100 | #248 | Tragic $90,909 |
| Mexican American Indians | 0.8 /100 | #249 | Tragic $90,811 |
Demographics Similar to Comanche by Householder Income Ages 45 - 64 years
In terms of householder income ages 45 - 64 years, the demographic groups most similar to Comanche are Immigrants from Central America ($85,965, a difference of 0.21%), Hispanic or Latino ($86,006, a difference of 0.25%), British West Indian ($85,571, a difference of 0.25%), Immigrants from Grenada ($85,552, a difference of 0.27%), and Cherokee ($86,125, a difference of 0.39%).
| Demographics | Rating | Rank | Householder Income Ages 45 - 64 years |
| Immigrants | Guatemala | 0.1 /100 | #286 | Tragic $86,573 |
| Bangladeshis | 0.1 /100 | #287 | Tragic $86,402 |
| Immigrants | St. Vincent and the Grenadines | 0.1 /100 | #288 | Tragic $86,394 |
| Cubans | 0.1 /100 | #289 | Tragic $86,301 |
| Cherokee | 0.1 /100 | #290 | Tragic $86,125 |
| Hispanics or Latinos | 0.1 /100 | #291 | Tragic $86,006 |
| Immigrants | Central America | 0.1 /100 | #292 | Tragic $85,965 |
| Comanche | 0.1 /100 | #293 | Tragic $85,787 |
| British West Indians | 0.1 /100 | #294 | Tragic $85,571 |
| Immigrants | Grenada | 0.1 /100 | #295 | Tragic $85,552 |
| Immigrants | Zaire | 0.1 /100 | #296 | Tragic $85,207 |
| Fijians | 0.1 /100 | #297 | Tragic $85,187 |
| Africans | 0.0 /100 | #298 | Tragic $84,925 |
| Immigrants | Mexico | 0.0 /100 | #299 | Tragic $84,910 |
| Indonesians | 0.0 /100 | #300 | Tragic $84,890 |