Inupiat vs Welsh Householder Income Ages 45 - 64 years
COMPARE
Inupiat
Welsh
Householder Income Ages 45 - 64 years
Householder Income Ages 45 - 64 years Comparison
Inupiat
Welsh
$91,355
HOUSEHOLDER INCOME AGES 45 - 64 YEARS
1.1/ 100
METRIC RATING
242nd/ 347
METRIC RANK
$100,322
HOUSEHOLDER INCOME AGES 45 - 64 YEARS
50.0/ 100
METRIC RATING
174th/ 347
METRIC RANK
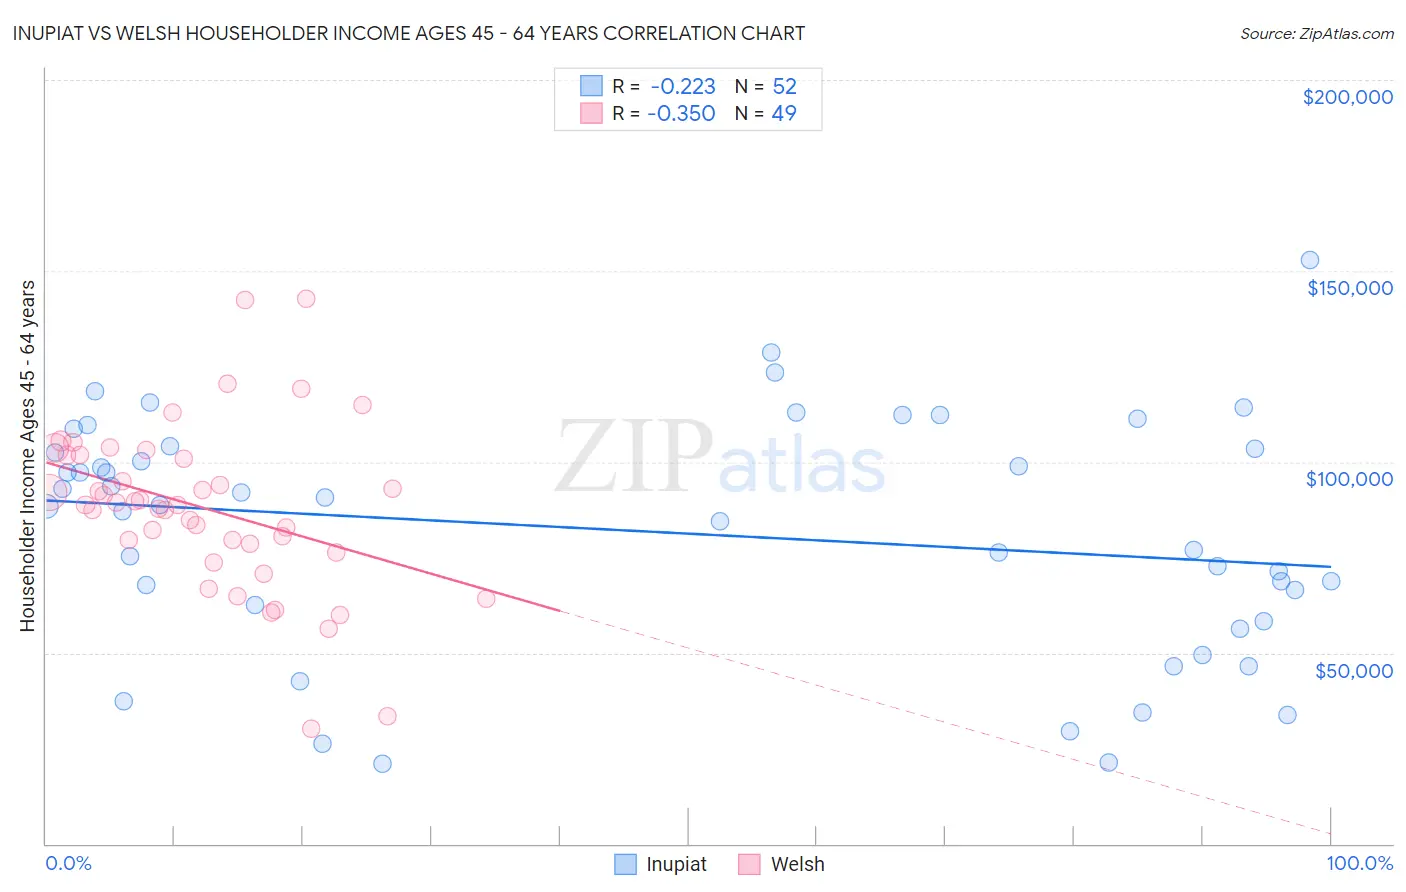
Inupiat vs Welsh Householder Income Ages 45 - 64 years Correlation Chart
The statistical analysis conducted on geographies consisting of 96,273,732 people shows a weak negative correlation between the proportion of Inupiat and household income with householder between the ages 45 and 64 in the United States with a correlation coefficient (R) of -0.223 and weighted average of $91,355. Similarly, the statistical analysis conducted on geographies consisting of 526,360,358 people shows a mild negative correlation between the proportion of Welsh and household income with householder between the ages 45 and 64 in the United States with a correlation coefficient (R) of -0.350 and weighted average of $100,322, a difference of 9.8%.
Householder Income Ages 45 - 64 years Correlation Summary
| Measurement | Inupiat | Welsh |
| Minimum | $20,833 | $30,217 |
| Maximum | $152,917 | $142,813 |
| Range | $132,084 | $112,596 |
| Mean | $81,669 | $87,855 |
| Median | $88,444 | $88,674 |
| Interquartile 25% (IQ1) | $60,416 | $77,359 |
| Interquartile 75% (IQ3) | $103,725 | $101,863 |
| Interquartile Range (IQR) | $43,309 | $24,505 |
| Standard Deviation (Sample) | $30,923 | $22,164 |
| Standard Deviation (Population) | $30,625 | $21,937 |
Similar Demographics by Householder Income Ages 45 - 64 years
Demographics Similar to Inupiat by Householder Income Ages 45 - 64 years
In terms of householder income ages 45 - 64 years, the demographic groups most similar to Inupiat are Trinidadian and Tobagonian ($91,357, a difference of 0.0%), Immigrants from Trinidad and Tobago ($91,347, a difference of 0.010%), Immigrants from Burma/Myanmar ($91,385, a difference of 0.030%), Immigrants from Middle Africa ($91,293, a difference of 0.070%), and Immigrants from Ecuador ($91,462, a difference of 0.12%).
| Demographics | Rating | Rank | Householder Income Ages 45 - 64 years |
| Nicaraguans | 2.0 /100 | #235 | Tragic $92,554 |
| Immigrants | Western Africa | 1.8 /100 | #236 | Tragic $92,384 |
| Immigrants | Bangladesh | 1.7 /100 | #237 | Tragic $92,208 |
| Pennsylvania Germans | 1.5 /100 | #238 | Tragic $91,956 |
| Immigrants | Ecuador | 1.2 /100 | #239 | Tragic $91,462 |
| Immigrants | Burma/Myanmar | 1.1 /100 | #240 | Tragic $91,385 |
| Trinidadians and Tobagonians | 1.1 /100 | #241 | Tragic $91,357 |
| Inupiat | 1.1 /100 | #242 | Tragic $91,355 |
| Immigrants | Trinidad and Tobago | 1.1 /100 | #243 | Tragic $91,347 |
| Immigrants | Middle Africa | 1.1 /100 | #244 | Tragic $91,293 |
| Guyanese | 0.9 /100 | #245 | Tragic $90,966 |
| Central Americans | 0.9 /100 | #246 | Tragic $90,951 |
| Alaskan Athabascans | 0.9 /100 | #247 | Tragic $90,951 |
| Immigrants | Laos | 0.9 /100 | #248 | Tragic $90,909 |
| Mexican American Indians | 0.8 /100 | #249 | Tragic $90,811 |
Demographics Similar to Welsh by Householder Income Ages 45 - 64 years
In terms of householder income ages 45 - 64 years, the demographic groups most similar to Welsh are German ($100,224, a difference of 0.10%), Alsatian ($100,435, a difference of 0.11%), Immigrants from Costa Rica ($100,141, a difference of 0.18%), Moroccan ($100,138, a difference of 0.18%), and Immigrants from Uzbekistan ($100,523, a difference of 0.20%).
| Demographics | Rating | Rank | Householder Income Ages 45 - 64 years |
| Czechoslovakians | 63.0 /100 | #167 | Good $101,387 |
| South American Indians | 60.5 /100 | #168 | Good $101,171 |
| Guamanians/Chamorros | 60.5 /100 | #169 | Good $101,170 |
| Slovaks | 58.8 /100 | #170 | Average $101,029 |
| South Americans | 56.4 /100 | #171 | Average $100,837 |
| Immigrants | Uzbekistan | 52.5 /100 | #172 | Average $100,523 |
| Alsatians | 51.4 /100 | #173 | Average $100,435 |
| Welsh | 50.0 /100 | #174 | Average $100,322 |
| Germans | 48.8 /100 | #175 | Average $100,224 |
| Immigrants | Costa Rica | 47.7 /100 | #176 | Average $100,141 |
| Moroccans | 47.7 /100 | #177 | Average $100,138 |
| Immigrants | Cameroon | 47.0 /100 | #178 | Average $100,084 |
| Belgians | 46.7 /100 | #179 | Average $100,060 |
| Aleuts | 46.6 /100 | #180 | Average $100,052 |
| Immigrants | Immigrants | 45.3 /100 | #181 | Average $99,943 |