Inupiat vs Mexican Householder Income Ages 25 - 44 years
COMPARE
Inupiat
Mexican
Householder Income Ages 25 - 44 years
Householder Income Ages 25 - 44 years Comparison
Inupiat
Mexicans
$84,619
HOUSEHOLDER INCOME AGES 25 - 44 YEARS
0.4/ 100
METRIC RATING
261st/ 347
METRIC RANK
$80,427
HOUSEHOLDER INCOME AGES 25 - 44 YEARS
0.0/ 100
METRIC RATING
303rd/ 347
METRIC RANK
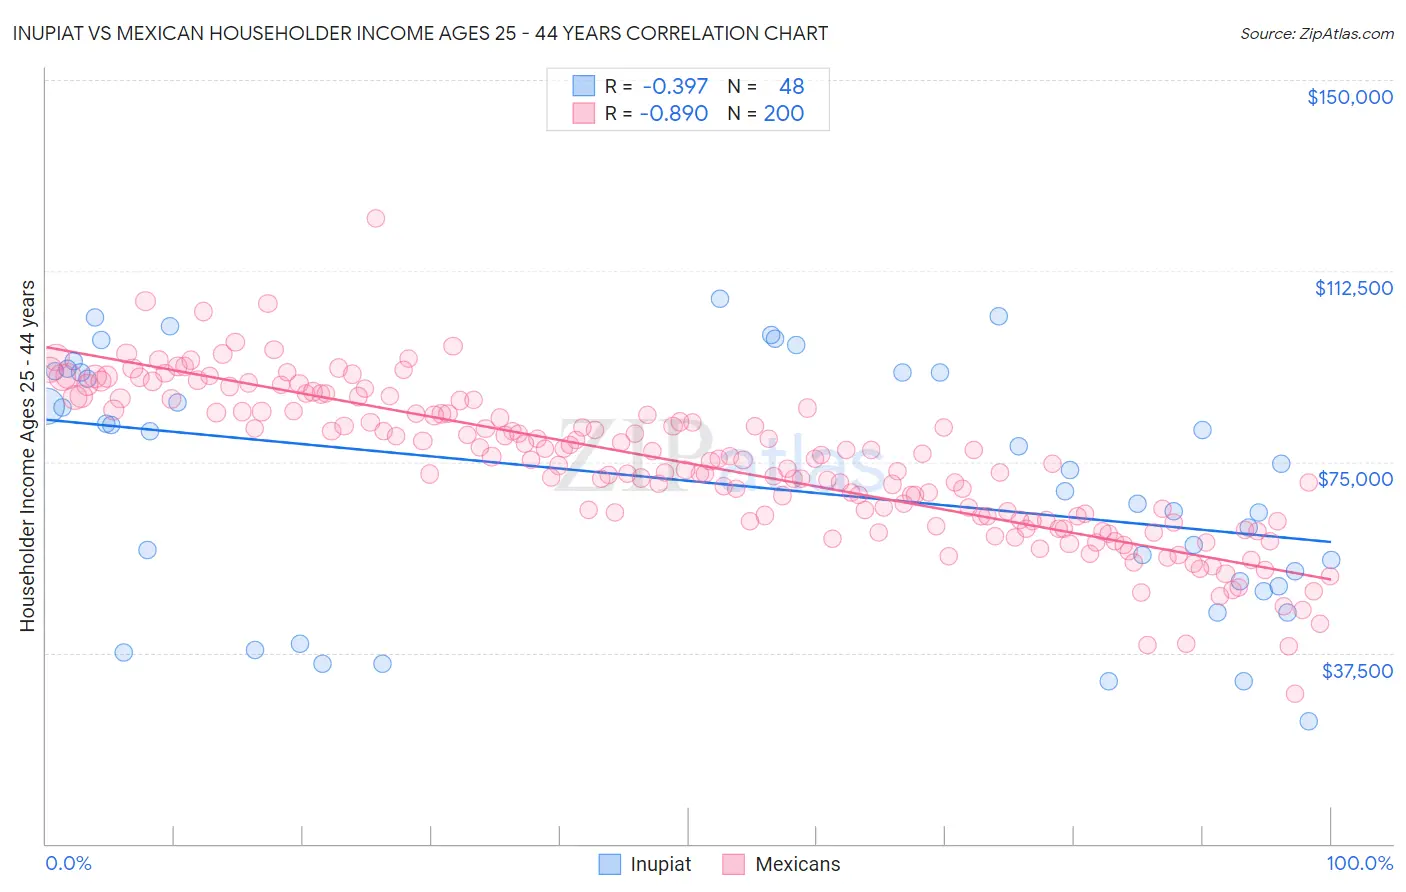
Inupiat vs Mexican Householder Income Ages 25 - 44 years Correlation Chart
The statistical analysis conducted on geographies consisting of 96,221,283 people shows a mild negative correlation between the proportion of Inupiat and household income with householder between the ages 25 and 44 in the United States with a correlation coefficient (R) of -0.397 and weighted average of $84,619. Similarly, the statistical analysis conducted on geographies consisting of 559,949,766 people shows a very strong negative correlation between the proportion of Mexicans and household income with householder between the ages 25 and 44 in the United States with a correlation coefficient (R) of -0.890 and weighted average of $80,427, a difference of 5.2%.
Householder Income Ages 25 - 44 years Correlation Summary
| Measurement | Inupiat | Mexican |
| Minimum | $24,167 | $29,496 |
| Maximum | $106,917 | $122,837 |
| Range | $82,750 | $93,341 |
| Mean | $70,828 | $74,718 |
| Median | $74,010 | $75,510 |
| Interquartile 25% (IQ1) | $51,032 | $63,535 |
| Interquartile 75% (IQ3) | $92,639 | $85,434 |
| Interquartile Range (IQR) | $41,608 | $21,899 |
| Standard Deviation (Sample) | $23,899 | $14,848 |
| Standard Deviation (Population) | $23,649 | $14,811 |
Similar Demographics by Householder Income Ages 25 - 44 years
Demographics Similar to Inupiat by Householder Income Ages 25 - 44 years
In terms of householder income ages 25 - 44 years, the demographic groups most similar to Inupiat are Cree ($84,574, a difference of 0.050%), Belizean ($84,534, a difference of 0.10%), Osage ($84,461, a difference of 0.19%), American ($84,791, a difference of 0.20%), and Sudanese ($84,401, a difference of 0.26%).
| Demographics | Rating | Rank | Householder Income Ages 25 - 44 years |
| Immigrants | Laos | 0.7 /100 | #254 | Tragic $85,553 |
| German Russians | 0.6 /100 | #255 | Tragic $85,220 |
| Central Americans | 0.5 /100 | #256 | Tragic $85,144 |
| Mexican American Indians | 0.5 /100 | #257 | Tragic $85,066 |
| Immigrants | Nicaragua | 0.5 /100 | #258 | Tragic $84,914 |
| Immigrants | Senegal | 0.5 /100 | #259 | Tragic $84,848 |
| Americans | 0.4 /100 | #260 | Tragic $84,791 |
| Inupiat | 0.4 /100 | #261 | Tragic $84,619 |
| Cree | 0.4 /100 | #262 | Tragic $84,574 |
| Belizeans | 0.4 /100 | #263 | Tragic $84,534 |
| Osage | 0.4 /100 | #264 | Tragic $84,461 |
| Sudanese | 0.4 /100 | #265 | Tragic $84,401 |
| Immigrants | Cabo Verde | 0.3 /100 | #266 | Tragic $84,304 |
| Hmong | 0.3 /100 | #267 | Tragic $84,258 |
| Sub-Saharan Africans | 0.3 /100 | #268 | Tragic $84,235 |
Demographics Similar to Mexicans by Householder Income Ages 25 - 44 years
In terms of householder income ages 25 - 44 years, the demographic groups most similar to Mexicans are Hispanic or Latino ($80,515, a difference of 0.11%), Immigrants from Caribbean ($80,326, a difference of 0.13%), Immigrants from Dominican Republic ($80,319, a difference of 0.13%), Immigrants from Micronesia ($80,544, a difference of 0.14%), and Apache ($80,260, a difference of 0.21%).
| Demographics | Rating | Rank | Householder Income Ages 25 - 44 years |
| Immigrants | Dominica | 0.1 /100 | #296 | Tragic $81,351 |
| Immigrants | Guatemala | 0.1 /100 | #297 | Tragic $81,341 |
| Dominicans | 0.1 /100 | #298 | Tragic $81,229 |
| Immigrants | Liberia | 0.1 /100 | #299 | Tragic $80,863 |
| Cherokee | 0.0 /100 | #300 | Tragic $80,843 |
| Immigrants | Micronesia | 0.0 /100 | #301 | Tragic $80,544 |
| Hispanics or Latinos | 0.0 /100 | #302 | Tragic $80,515 |
| Mexicans | 0.0 /100 | #303 | Tragic $80,427 |
| Immigrants | Caribbean | 0.0 /100 | #304 | Tragic $80,326 |
| Immigrants | Dominican Republic | 0.0 /100 | #305 | Tragic $80,319 |
| Apache | 0.0 /100 | #306 | Tragic $80,260 |
| Haitians | 0.0 /100 | #307 | Tragic $80,055 |
| Immigrants | Central America | 0.0 /100 | #308 | Tragic $80,012 |
| Chippewa | 0.0 /100 | #309 | Tragic $80,005 |
| Fijians | 0.0 /100 | #310 | Tragic $79,956 |