Inupiat vs Sioux Householder Income Ages 25 - 44 years
COMPARE
Inupiat
Sioux
Householder Income Ages 25 - 44 years
Householder Income Ages 25 - 44 years Comparison
Inupiat
Sioux
$84,619
HOUSEHOLDER INCOME AGES 25 - 44 YEARS
0.4/ 100
METRIC RATING
261st/ 347
METRIC RANK
$77,089
HOUSEHOLDER INCOME AGES 25 - 44 YEARS
0.0/ 100
METRIC RATING
325th/ 347
METRIC RANK
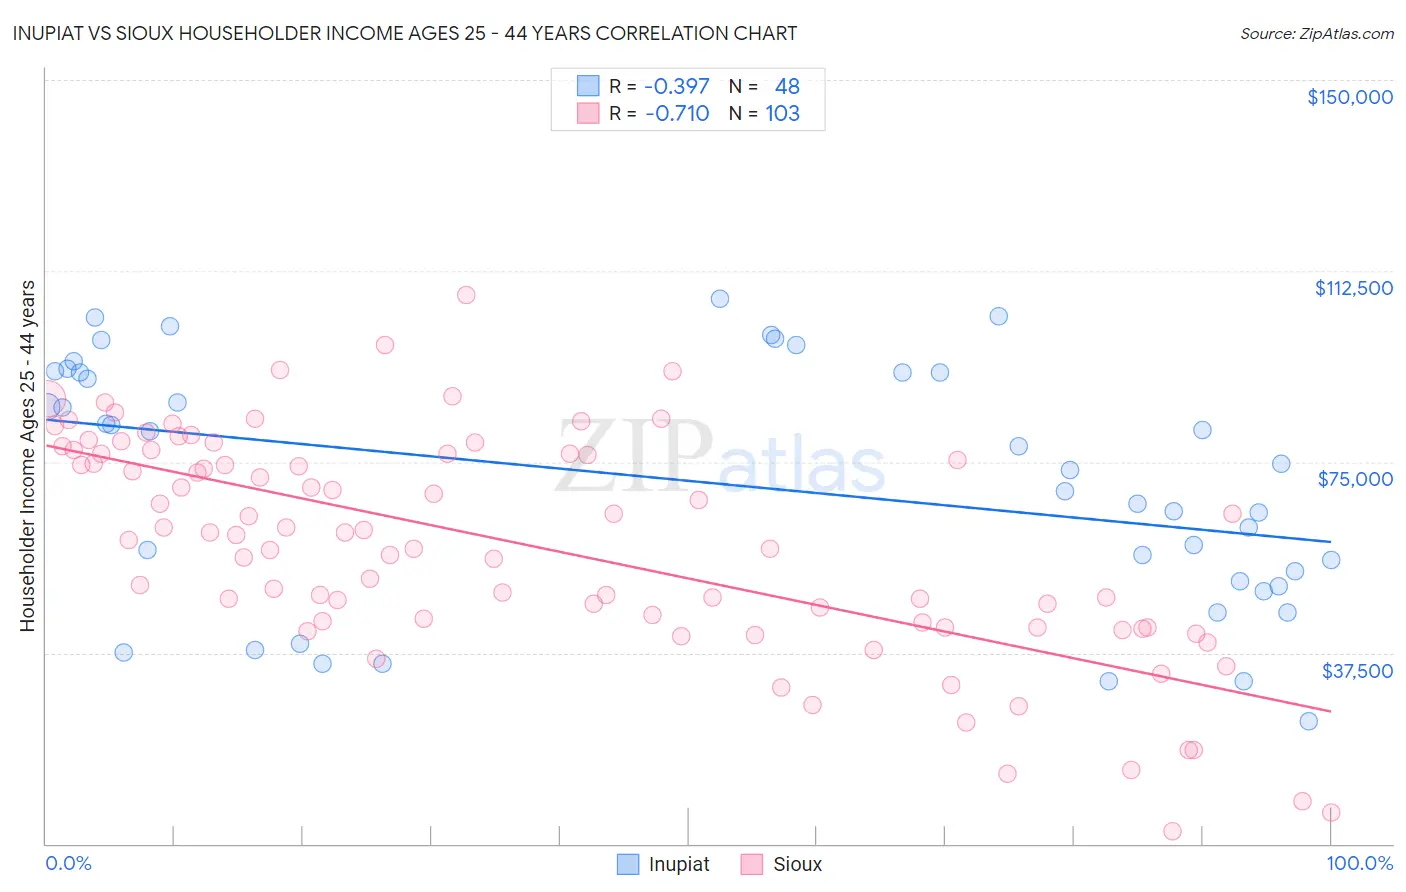
Inupiat vs Sioux Householder Income Ages 25 - 44 years Correlation Chart
The statistical analysis conducted on geographies consisting of 96,221,283 people shows a mild negative correlation between the proportion of Inupiat and household income with householder between the ages 25 and 44 in the United States with a correlation coefficient (R) of -0.397 and weighted average of $84,619. Similarly, the statistical analysis conducted on geographies consisting of 233,739,759 people shows a strong negative correlation between the proportion of Sioux and household income with householder between the ages 25 and 44 in the United States with a correlation coefficient (R) of -0.710 and weighted average of $77,089, a difference of 9.8%.
Householder Income Ages 25 - 44 years Correlation Summary
| Measurement | Inupiat | Sioux |
| Minimum | $24,167 | $2,499 |
| Maximum | $106,917 | $107,750 |
| Range | $82,750 | $105,251 |
| Mean | $70,828 | $58,364 |
| Median | $74,010 | $60,620 |
| Interquartile 25% (IQ1) | $51,032 | $42,554 |
| Interquartile 75% (IQ3) | $92,639 | $76,563 |
| Interquartile Range (IQR) | $41,608 | $34,009 |
| Standard Deviation (Sample) | $23,899 | $21,906 |
| Standard Deviation (Population) | $23,649 | $21,799 |
Similar Demographics by Householder Income Ages 25 - 44 years
Demographics Similar to Inupiat by Householder Income Ages 25 - 44 years
In terms of householder income ages 25 - 44 years, the demographic groups most similar to Inupiat are Cree ($84,574, a difference of 0.050%), Belizean ($84,534, a difference of 0.10%), Osage ($84,461, a difference of 0.19%), American ($84,791, a difference of 0.20%), and Sudanese ($84,401, a difference of 0.26%).
| Demographics | Rating | Rank | Householder Income Ages 25 - 44 years |
| Immigrants | Laos | 0.7 /100 | #254 | Tragic $85,553 |
| German Russians | 0.6 /100 | #255 | Tragic $85,220 |
| Central Americans | 0.5 /100 | #256 | Tragic $85,144 |
| Mexican American Indians | 0.5 /100 | #257 | Tragic $85,066 |
| Immigrants | Nicaragua | 0.5 /100 | #258 | Tragic $84,914 |
| Immigrants | Senegal | 0.5 /100 | #259 | Tragic $84,848 |
| Americans | 0.4 /100 | #260 | Tragic $84,791 |
| Inupiat | 0.4 /100 | #261 | Tragic $84,619 |
| Cree | 0.4 /100 | #262 | Tragic $84,574 |
| Belizeans | 0.4 /100 | #263 | Tragic $84,534 |
| Osage | 0.4 /100 | #264 | Tragic $84,461 |
| Sudanese | 0.4 /100 | #265 | Tragic $84,401 |
| Immigrants | Cabo Verde | 0.3 /100 | #266 | Tragic $84,304 |
| Hmong | 0.3 /100 | #267 | Tragic $84,258 |
| Sub-Saharan Africans | 0.3 /100 | #268 | Tragic $84,235 |
Demographics Similar to Sioux by Householder Income Ages 25 - 44 years
In terms of householder income ages 25 - 44 years, the demographic groups most similar to Sioux are Houma ($77,044, a difference of 0.060%), Dutch West Indian ($77,260, a difference of 0.22%), Immigrants from Bahamas ($76,910, a difference of 0.23%), Immigrants from Honduras ($77,328, a difference of 0.31%), and Immigrants from Cuba ($76,701, a difference of 0.51%).
| Demographics | Rating | Rank | Householder Income Ages 25 - 44 years |
| Immigrants | Mexico | 0.0 /100 | #318 | Tragic $78,809 |
| Hondurans | 0.0 /100 | #319 | Tragic $78,540 |
| Choctaw | 0.0 /100 | #320 | Tragic $78,168 |
| Immigrants | Zaire | 0.0 /100 | #321 | Tragic $78,045 |
| Chickasaw | 0.0 /100 | #322 | Tragic $77,929 |
| Immigrants | Honduras | 0.0 /100 | #323 | Tragic $77,328 |
| Dutch West Indians | 0.0 /100 | #324 | Tragic $77,260 |
| Sioux | 0.0 /100 | #325 | Tragic $77,089 |
| Houma | 0.0 /100 | #326 | Tragic $77,044 |
| Immigrants | Bahamas | 0.0 /100 | #327 | Tragic $76,910 |
| Immigrants | Cuba | 0.0 /100 | #328 | Tragic $76,701 |
| Seminole | 0.0 /100 | #329 | Tragic $76,584 |
| Yakama | 0.0 /100 | #330 | Tragic $76,226 |
| Natives/Alaskans | 0.0 /100 | #331 | Tragic $75,647 |
| Bahamians | 0.0 /100 | #332 | Tragic $75,395 |