Immigrants from Somalia vs Immigrants from Syria Median Household Income
COMPARE
Immigrants from Somalia
Immigrants from Syria
Median Household Income
Median Household Income Comparison
Immigrants from Somalia
Immigrants from Syria
$74,300
MEDIAN HOUSEHOLD INCOME
0.1/ 100
METRIC RATING
286th/ 347
METRIC RANK
$88,792
MEDIAN HOUSEHOLD INCOME
91.4/ 100
METRIC RATING
131st/ 347
METRIC RANK
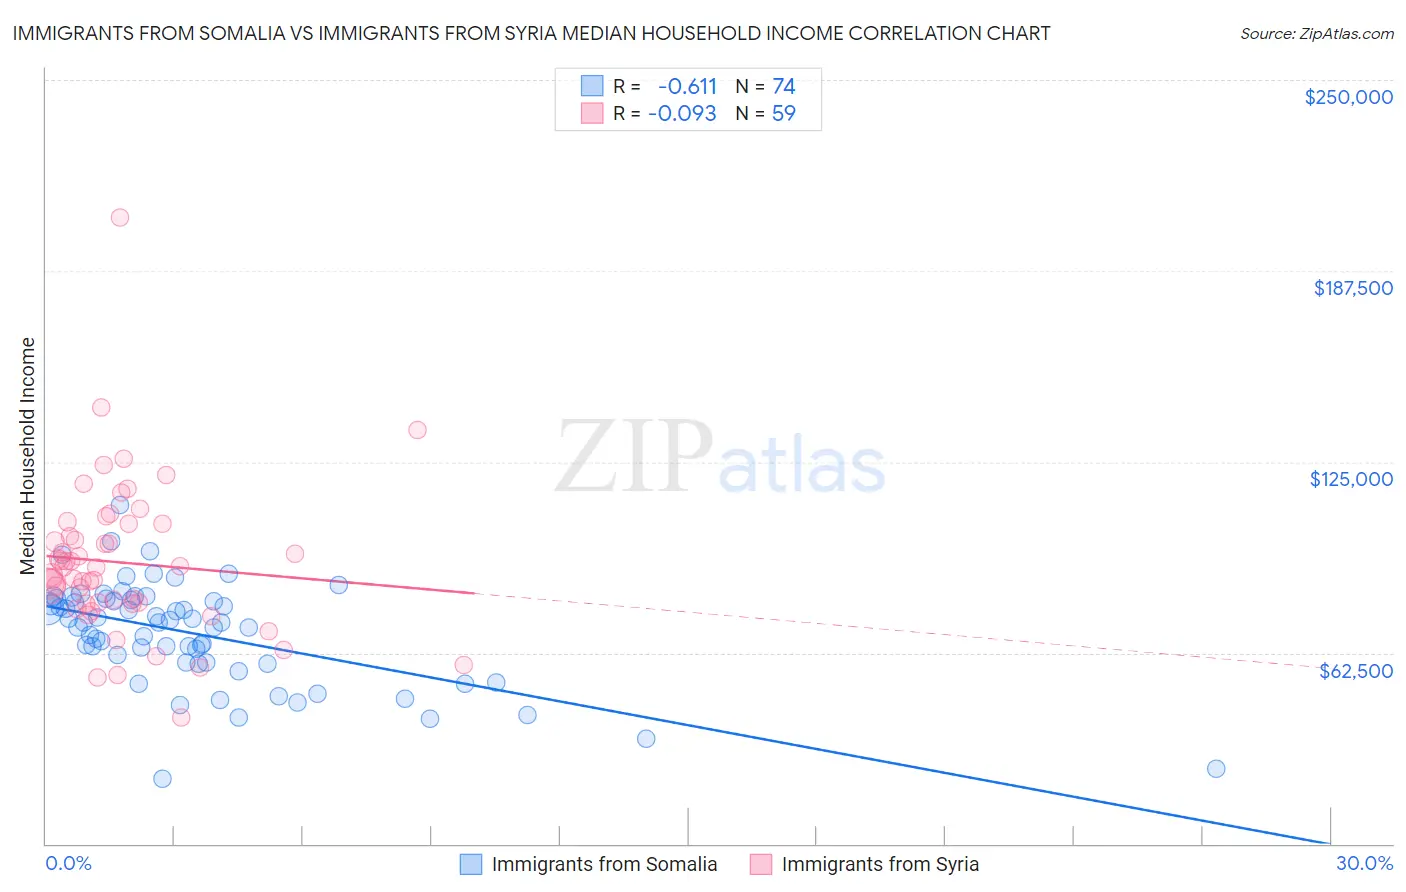
Immigrants from Somalia vs Immigrants from Syria Median Household Income Correlation Chart
The statistical analysis conducted on geographies consisting of 92,093,487 people shows a significant negative correlation between the proportion of Immigrants from Somalia and median household income in the United States with a correlation coefficient (R) of -0.611 and weighted average of $74,300. Similarly, the statistical analysis conducted on geographies consisting of 174,102,595 people shows a slight negative correlation between the proportion of Immigrants from Syria and median household income in the United States with a correlation coefficient (R) of -0.093 and weighted average of $88,792, a difference of 19.5%.
Median Household Income Correlation Summary
| Measurement | Immigrants from Somalia | Immigrants from Syria |
| Minimum | $21,288 | $41,250 |
| Maximum | $111,048 | $204,875 |
| Range | $89,760 | $163,625 |
| Mean | $68,739 | $92,001 |
| Median | $72,392 | $90,604 |
| Interquartile 25% (IQ1) | $59,132 | $78,558 |
| Interquartile 75% (IQ3) | $79,747 | $104,604 |
| Interquartile Range (IQR) | $20,615 | $26,046 |
| Standard Deviation (Sample) | $16,683 | $25,121 |
| Standard Deviation (Population) | $16,570 | $24,907 |
Similar Demographics by Median Household Income
Demographics Similar to Immigrants from Somalia by Median Household Income
In terms of median household income, the demographic groups most similar to Immigrants from Somalia are Iroquois ($74,279, a difference of 0.030%), Immigrants from Central America ($74,217, a difference of 0.11%), Mexican ($74,399, a difference of 0.13%), Fijian ($74,205, a difference of 0.13%), and Bangladeshi ($74,112, a difference of 0.25%).
| Demographics | Rating | Rank | Median Household Income |
| Immigrants | Guatemala | 0.2 /100 | #279 | Tragic $75,123 |
| Senegalese | 0.2 /100 | #280 | Tragic $74,999 |
| Immigrants | Liberia | 0.1 /100 | #281 | Tragic $74,896 |
| Central American Indians | 0.1 /100 | #282 | Tragic $74,847 |
| Cree | 0.1 /100 | #283 | Tragic $74,685 |
| Yaqui | 0.1 /100 | #284 | Tragic $74,596 |
| Mexicans | 0.1 /100 | #285 | Tragic $74,399 |
| Immigrants | Somalia | 0.1 /100 | #286 | Tragic $74,300 |
| Iroquois | 0.1 /100 | #287 | Tragic $74,279 |
| Immigrants | Central America | 0.1 /100 | #288 | Tragic $74,217 |
| Fijians | 0.1 /100 | #289 | Tragic $74,205 |
| Bangladeshis | 0.1 /100 | #290 | Tragic $74,112 |
| Hispanics or Latinos | 0.1 /100 | #291 | Tragic $73,823 |
| Comanche | 0.1 /100 | #292 | Tragic $73,747 |
| Immigrants | Cabo Verde | 0.1 /100 | #293 | Tragic $73,515 |
Demographics Similar to Immigrants from Syria by Median Household Income
In terms of median household income, the demographic groups most similar to Immigrants from Syria are European ($88,751, a difference of 0.050%), Immigrants from Ethiopia ($88,687, a difference of 0.12%), British ($88,914, a difference of 0.14%), Brazilian ($88,934, a difference of 0.16%), and Portuguese ($88,976, a difference of 0.21%).
| Demographics | Rating | Rank | Median Household Income |
| Immigrants | Jordan | 94.1 /100 | #124 | Exceptional $89,412 |
| Immigrants | Kuwait | 93.5 /100 | #125 | Exceptional $89,263 |
| Immigrants | Oceania | 92.9 /100 | #126 | Exceptional $89,100 |
| Immigrants | Peru | 92.5 /100 | #127 | Exceptional $89,010 |
| Portuguese | 92.3 /100 | #128 | Exceptional $88,976 |
| Brazilians | 92.1 /100 | #129 | Exceptional $88,934 |
| British | 92.0 /100 | #130 | Exceptional $88,914 |
| Immigrants | Syria | 91.4 /100 | #131 | Exceptional $88,792 |
| Europeans | 91.2 /100 | #132 | Exceptional $88,751 |
| Immigrants | Ethiopia | 90.9 /100 | #133 | Exceptional $88,687 |
| Swedes | 90.0 /100 | #134 | Exceptional $88,524 |
| Immigrants | Sierra Leone | 89.9 /100 | #135 | Excellent $88,498 |
| Poles | 89.7 /100 | #136 | Excellent $88,472 |
| Sierra Leoneans | 89.6 /100 | #137 | Excellent $88,463 |
| Arabs | 89.2 /100 | #138 | Excellent $88,398 |