Immigrants from Western Africa vs Immigrants from Syria Median Household Income
COMPARE
Immigrants from Western Africa
Immigrants from Syria
Median Household Income
Median Household Income Comparison
Immigrants from Western Africa
Immigrants from Syria
$79,490
MEDIAN HOUSEHOLD INCOME
2.7/ 100
METRIC RATING
240th/ 347
METRIC RANK
$88,792
MEDIAN HOUSEHOLD INCOME
91.4/ 100
METRIC RATING
131st/ 347
METRIC RANK
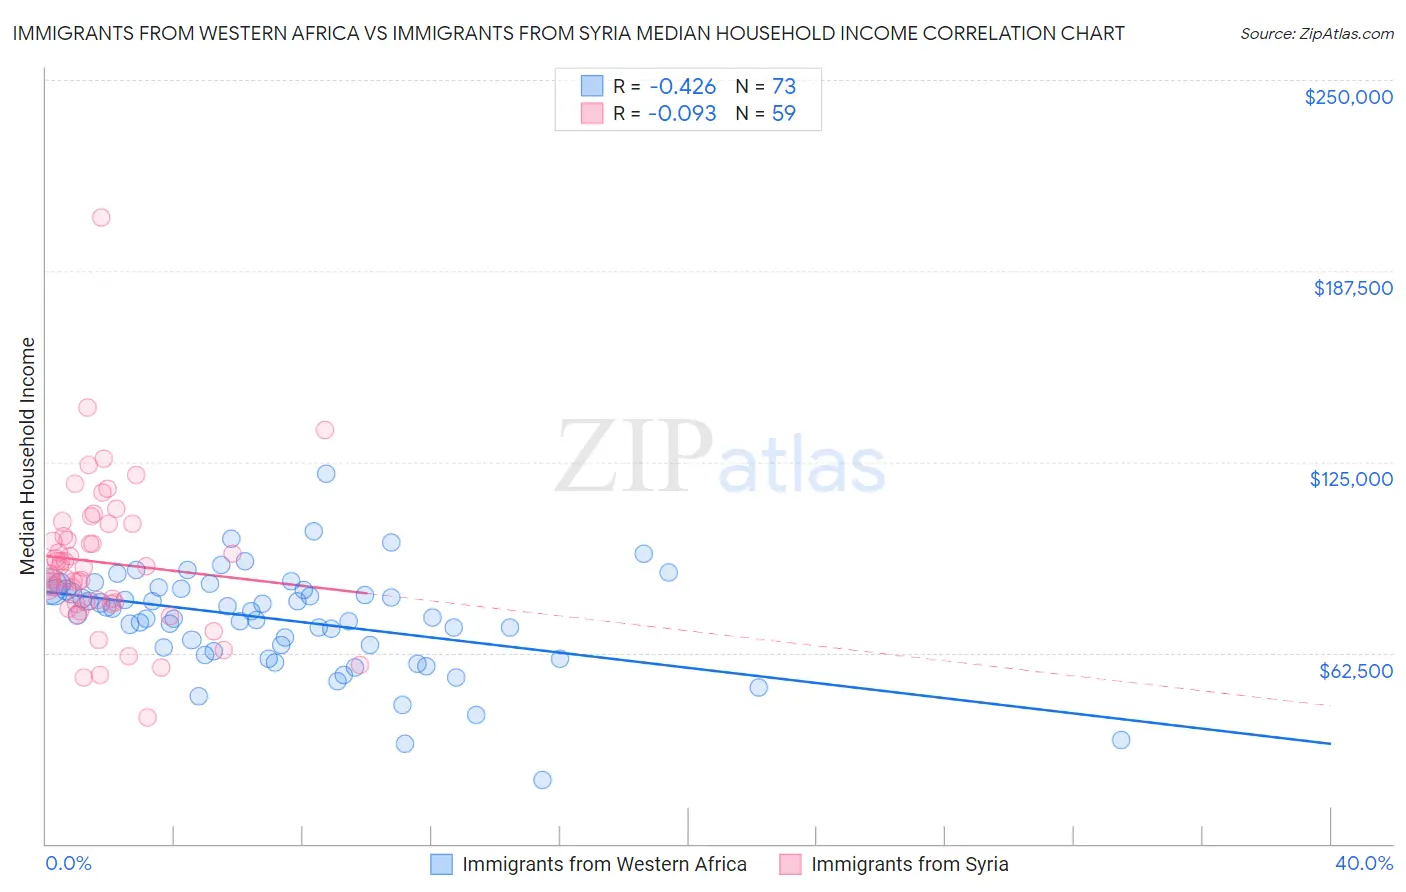
Immigrants from Western Africa vs Immigrants from Syria Median Household Income Correlation Chart
The statistical analysis conducted on geographies consisting of 357,459,311 people shows a moderate negative correlation between the proportion of Immigrants from Western Africa and median household income in the United States with a correlation coefficient (R) of -0.426 and weighted average of $79,490. Similarly, the statistical analysis conducted on geographies consisting of 174,102,595 people shows a slight negative correlation between the proportion of Immigrants from Syria and median household income in the United States with a correlation coefficient (R) of -0.093 and weighted average of $88,792, a difference of 11.7%.
Median Household Income Correlation Summary
| Measurement | Immigrants from Western Africa | Immigrants from Syria |
| Minimum | $20,699 | $41,250 |
| Maximum | $120,953 | $204,875 |
| Range | $100,254 | $163,625 |
| Mean | $73,270 | $92,001 |
| Median | $74,855 | $90,604 |
| Interquartile 25% (IQ1) | $63,706 | $78,558 |
| Interquartile 75% (IQ3) | $83,237 | $104,604 |
| Interquartile Range (IQR) | $19,531 | $26,046 |
| Standard Deviation (Sample) | $16,693 | $25,121 |
| Standard Deviation (Population) | $16,579 | $24,907 |
Similar Demographics by Median Household Income
Demographics Similar to Immigrants from Western Africa by Median Household Income
In terms of median household income, the demographic groups most similar to Immigrants from Western Africa are Alaska Native ($79,509, a difference of 0.020%), Nonimmigrants ($79,429, a difference of 0.080%), Barbadian ($79,664, a difference of 0.22%), Nicaraguan ($79,737, a difference of 0.31%), and Immigrants from Sudan ($79,103, a difference of 0.49%).
| Demographics | Rating | Rank | Median Household Income |
| Immigrants | Azores | 4.5 /100 | #233 | Tragic $80,357 |
| Immigrants | Ecuador | 4.5 /100 | #234 | Tragic $80,341 |
| Immigrants | Guyana | 4.5 /100 | #235 | Tragic $80,324 |
| Immigrants | Bosnia and Herzegovina | 3.4 /100 | #236 | Tragic $79,888 |
| Nicaraguans | 3.1 /100 | #237 | Tragic $79,737 |
| Barbadians | 3.0 /100 | #238 | Tragic $79,664 |
| Alaska Natives | 2.7 /100 | #239 | Tragic $79,509 |
| Immigrants | Western Africa | 2.7 /100 | #240 | Tragic $79,490 |
| Immigrants | Nonimmigrants | 2.6 /100 | #241 | Tragic $79,429 |
| Immigrants | Sudan | 2.1 /100 | #242 | Tragic $79,103 |
| Immigrants | Barbados | 1.9 /100 | #243 | Tragic $78,989 |
| Marshallese | 1.9 /100 | #244 | Tragic $78,930 |
| Inupiat | 1.8 /100 | #245 | Tragic $78,841 |
| Central Americans | 1.7 /100 | #246 | Tragic $78,803 |
| Immigrants | Burma/Myanmar | 1.6 /100 | #247 | Tragic $78,682 |
Demographics Similar to Immigrants from Syria by Median Household Income
In terms of median household income, the demographic groups most similar to Immigrants from Syria are European ($88,751, a difference of 0.050%), Immigrants from Ethiopia ($88,687, a difference of 0.12%), British ($88,914, a difference of 0.14%), Brazilian ($88,934, a difference of 0.16%), and Portuguese ($88,976, a difference of 0.21%).
| Demographics | Rating | Rank | Median Household Income |
| Immigrants | Jordan | 94.1 /100 | #124 | Exceptional $89,412 |
| Immigrants | Kuwait | 93.5 /100 | #125 | Exceptional $89,263 |
| Immigrants | Oceania | 92.9 /100 | #126 | Exceptional $89,100 |
| Immigrants | Peru | 92.5 /100 | #127 | Exceptional $89,010 |
| Portuguese | 92.3 /100 | #128 | Exceptional $88,976 |
| Brazilians | 92.1 /100 | #129 | Exceptional $88,934 |
| British | 92.0 /100 | #130 | Exceptional $88,914 |
| Immigrants | Syria | 91.4 /100 | #131 | Exceptional $88,792 |
| Europeans | 91.2 /100 | #132 | Exceptional $88,751 |
| Immigrants | Ethiopia | 90.9 /100 | #133 | Exceptional $88,687 |
| Swedes | 90.0 /100 | #134 | Exceptional $88,524 |
| Immigrants | Sierra Leone | 89.9 /100 | #135 | Excellent $88,498 |
| Poles | 89.7 /100 | #136 | Excellent $88,472 |
| Sierra Leoneans | 89.6 /100 | #137 | Excellent $88,463 |
| Arabs | 89.2 /100 | #138 | Excellent $88,398 |