Houma vs Ghanaian Median Earnings
COMPARE
Houma
Ghanaian
Median Earnings
Median Earnings Comparison
Houma
Ghanaians
$38,949
MEDIAN EARNINGS
0.0/ 100
METRIC RATING
333rd/ 347
METRIC RANK
$46,440
MEDIAN EARNINGS
50.3/ 100
METRIC RATING
173rd/ 347
METRIC RANK
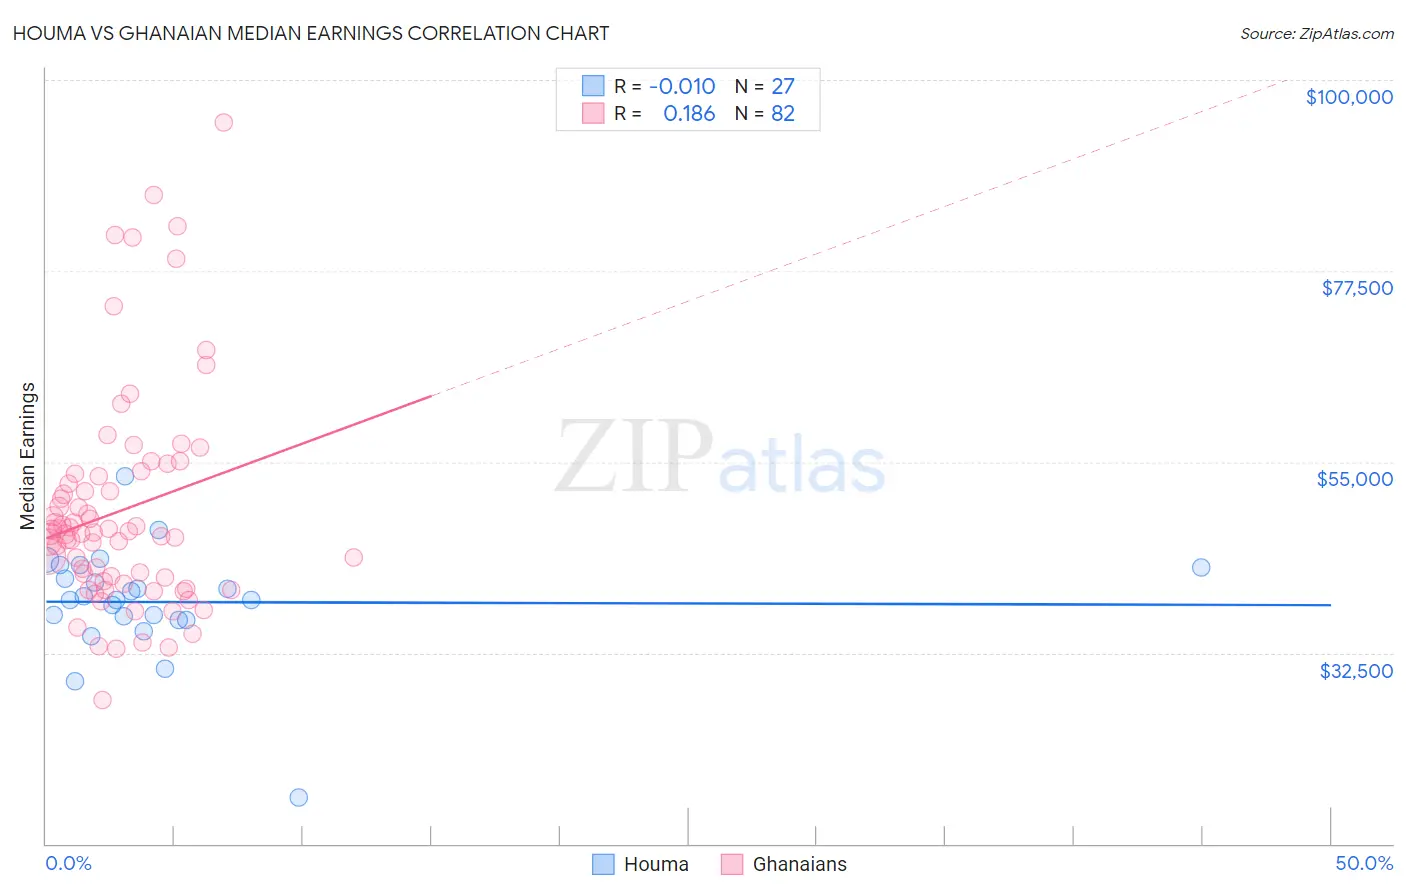
Houma vs Ghanaian Median Earnings Correlation Chart
The statistical analysis conducted on geographies consisting of 36,796,366 people shows no correlation between the proportion of Houma and median earnings in the United States with a correlation coefficient (R) of -0.010 and weighted average of $38,949. Similarly, the statistical analysis conducted on geographies consisting of 190,721,240 people shows a poor positive correlation between the proportion of Ghanaians and median earnings in the United States with a correlation coefficient (R) of 0.186 and weighted average of $46,440, a difference of 19.2%.
Median Earnings Correlation Summary
| Measurement | Houma | Ghanaian |
| Minimum | $15,495 | $26,919 |
| Maximum | $53,358 | $94,961 |
| Range | $37,863 | $68,042 |
| Mean | $38,485 | $49,239 |
| Median | $38,771 | $46,600 |
| Interquartile 25% (IQ1) | $36,392 | $40,949 |
| Interquartile 75% (IQ3) | $42,500 | $53,241 |
| Interquartile Range (IQR) | $6,108 | $12,292 |
| Standard Deviation (Sample) | $6,619 | $12,902 |
| Standard Deviation (Population) | $6,495 | $12,823 |
Similar Demographics by Median Earnings
Demographics Similar to Houma by Median Earnings
In terms of median earnings, the demographic groups most similar to Houma are Spanish American Indian ($38,907, a difference of 0.11%), Native/Alaskan ($38,896, a difference of 0.14%), Yakama ($39,107, a difference of 0.41%), Immigrants from Mexico ($39,114, a difference of 0.42%), and Immigrants from Congo ($39,169, a difference of 0.57%).
| Demographics | Rating | Rank | Median Earnings |
| Immigrants | Yemen | 0.0 /100 | #326 | Tragic $39,540 |
| Yuman | 0.0 /100 | #327 | Tragic $39,523 |
| Sioux | 0.0 /100 | #328 | Tragic $39,448 |
| Kiowa | 0.0 /100 | #329 | Tragic $39,232 |
| Immigrants | Congo | 0.0 /100 | #330 | Tragic $39,169 |
| Immigrants | Mexico | 0.0 /100 | #331 | Tragic $39,114 |
| Yakama | 0.0 /100 | #332 | Tragic $39,107 |
| Houma | 0.0 /100 | #333 | Tragic $38,949 |
| Spanish American Indians | 0.0 /100 | #334 | Tragic $38,907 |
| Natives/Alaskans | 0.0 /100 | #335 | Tragic $38,896 |
| Crow | 0.0 /100 | #336 | Tragic $38,707 |
| Immigrants | Cuba | 0.0 /100 | #337 | Tragic $38,426 |
| Pima | 0.0 /100 | #338 | Tragic $38,285 |
| Menominee | 0.0 /100 | #339 | Tragic $37,884 |
| Navajo | 0.0 /100 | #340 | Tragic $36,999 |
Demographics Similar to Ghanaians by Median Earnings
In terms of median earnings, the demographic groups most similar to Ghanaians are Scandinavian ($46,433, a difference of 0.020%), Scottish ($46,463, a difference of 0.050%), Kenyan ($46,462, a difference of 0.050%), Immigrants ($46,478, a difference of 0.080%), and Basque ($46,399, a difference of 0.090%).
| Demographics | Rating | Rank | Median Earnings |
| Czechoslovakians | 57.8 /100 | #166 | Average $46,658 |
| Costa Ricans | 57.4 /100 | #167 | Average $46,645 |
| Immigrants | Africa | 54.6 /100 | #168 | Average $46,564 |
| Immigrants | South America | 54.0 /100 | #169 | Average $46,548 |
| Immigrants | Immigrants | 51.6 /100 | #170 | Average $46,478 |
| Scottish | 51.1 /100 | #171 | Average $46,463 |
| Kenyans | 51.0 /100 | #172 | Average $46,462 |
| Ghanaians | 50.3 /100 | #173 | Average $46,440 |
| Scandinavians | 50.0 /100 | #174 | Average $46,433 |
| Basques | 48.8 /100 | #175 | Average $46,399 |
| Danes | 48.6 /100 | #176 | Average $46,392 |
| Belgians | 48.0 /100 | #177 | Average $46,375 |
| Colombians | 47.1 /100 | #178 | Average $46,349 |
| English | 46.5 /100 | #179 | Average $46,334 |
| Puget Sound Salish | 46.5 /100 | #180 | Average $46,333 |