Colombian vs Ghanaian Householder Income Over 65 years
COMPARE
Colombian
Ghanaian
Householder Income Over 65 years
Householder Income Over 65 years Comparison
Colombians
Ghanaians
$58,851
HOUSEHOLDER INCOME OVER 65 YEARS
9.8/ 100
METRIC RATING
212th/ 347
METRIC RANK
$60,043
HOUSEHOLDER INCOME OVER 65 YEARS
27.5/ 100
METRIC RATING
189th/ 347
METRIC RANK
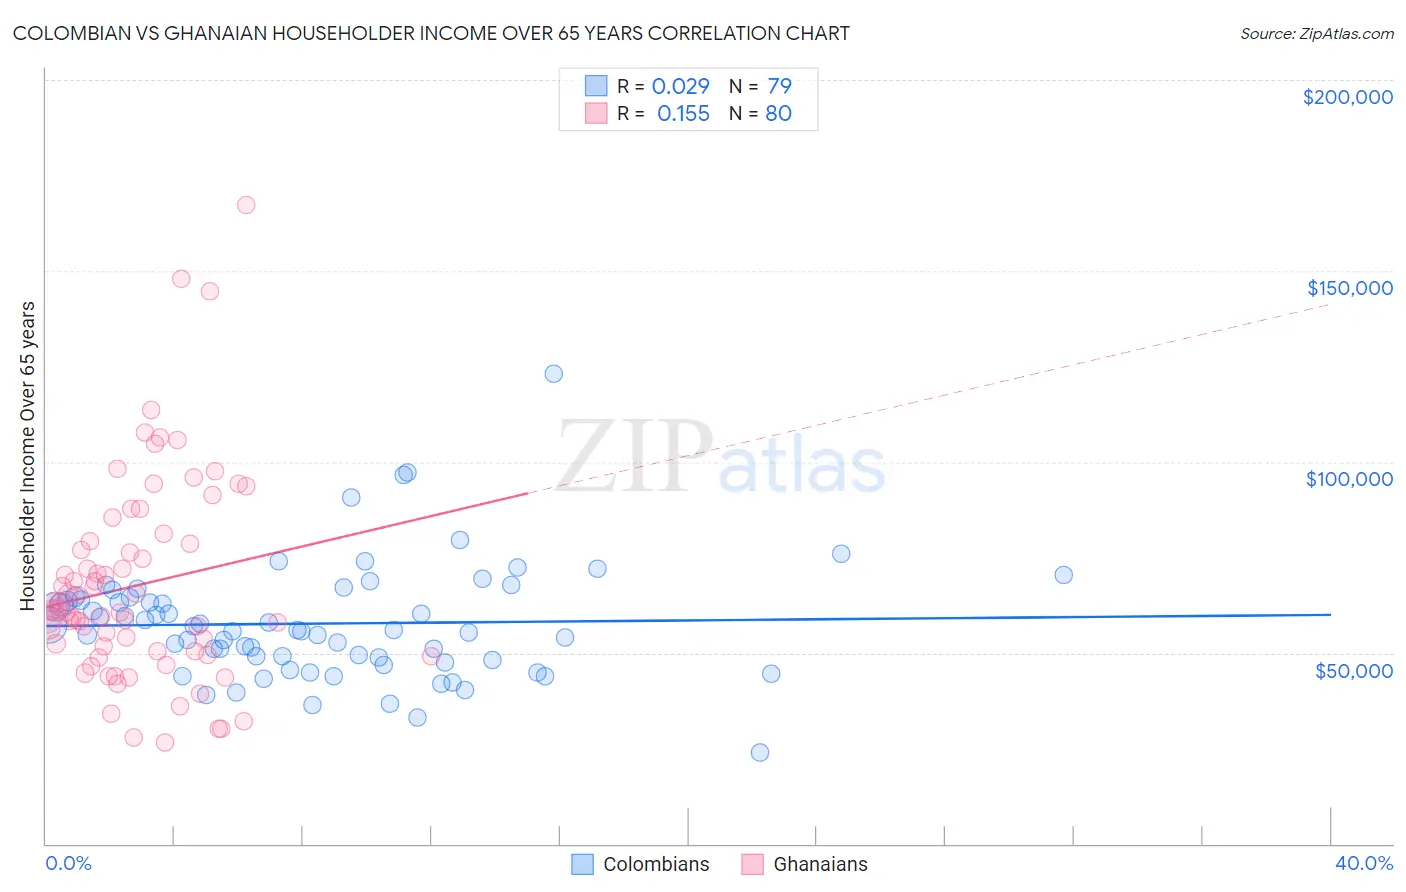
Colombian vs Ghanaian Householder Income Over 65 years Correlation Chart
The statistical analysis conducted on geographies consisting of 417,846,867 people shows no correlation between the proportion of Colombians and household income with householder over the age of 65 in the United States with a correlation coefficient (R) of 0.029 and weighted average of $58,851. Similarly, the statistical analysis conducted on geographies consisting of 190,075,998 people shows a poor positive correlation between the proportion of Ghanaians and household income with householder over the age of 65 in the United States with a correlation coefficient (R) of 0.155 and weighted average of $60,043, a difference of 2.0%.
Householder Income Over 65 years Correlation Summary
| Measurement | Colombian | Ghanaian |
| Minimum | $23,750 | $26,429 |
| Maximum | $123,173 | $167,368 |
| Range | $99,423 | $140,939 |
| Mean | $57,658 | $67,634 |
| Median | $55,908 | $61,218 |
| Interquartile 25% (IQ1) | $48,090 | $50,453 |
| Interquartile 75% (IQ3) | $64,612 | $78,943 |
| Interquartile Range (IQR) | $16,522 | $28,490 |
| Standard Deviation (Sample) | $15,165 | $26,645 |
| Standard Deviation (Population) | $15,069 | $26,478 |
Similar Demographics by Householder Income Over 65 years
Demographics Similar to Colombians by Householder Income Over 65 years
In terms of householder income over 65 years, the demographic groups most similar to Colombians are White/Caucasian ($58,847, a difference of 0.010%), Immigrants from Nigeria ($58,942, a difference of 0.15%), Nepalese ($58,761, a difference of 0.15%), Nigerian ($58,992, a difference of 0.24%), and Slovak ($59,039, a difference of 0.32%).
| Demographics | Rating | Rank | Householder Income Over 65 years |
| Immigrants | Sudan | 14.2 /100 | #205 | Poor $59,248 |
| Immigrants | South America | 13.0 /100 | #206 | Poor $59,151 |
| Salvadorans | 12.9 /100 | #207 | Poor $59,141 |
| Uruguayans | 12.3 /100 | #208 | Poor $59,090 |
| Slovaks | 11.7 /100 | #209 | Poor $59,039 |
| Nigerians | 11.2 /100 | #210 | Poor $58,992 |
| Immigrants | Nigeria | 10.7 /100 | #211 | Poor $58,942 |
| Colombians | 9.8 /100 | #212 | Tragic $58,851 |
| Whites/Caucasians | 9.8 /100 | #213 | Tragic $58,847 |
| Nepalese | 9.0 /100 | #214 | Tragic $58,761 |
| Immigrants | Ghana | 7.9 /100 | #215 | Tragic $58,624 |
| Immigrants | Middle Africa | 6.2 /100 | #216 | Tragic $58,375 |
| Sudanese | 5.7 /100 | #217 | Tragic $58,281 |
| Panamanians | 5.6 /100 | #218 | Tragic $58,266 |
| Malaysians | 5.5 /100 | #219 | Tragic $58,244 |
Demographics Similar to Ghanaians by Householder Income Over 65 years
In terms of householder income over 65 years, the demographic groups most similar to Ghanaians are Immigrants from Eritrea ($60,096, a difference of 0.090%), Puget Sound Salish ($59,934, a difference of 0.18%), Belgian ($59,915, a difference of 0.21%), Immigrants from Thailand ($60,217, a difference of 0.29%), and South American ($59,854, a difference of 0.32%).
| Demographics | Rating | Rank | Householder Income Over 65 years |
| Czechoslovakians | 40.0 /100 | #182 | Average $60,581 |
| Kenyans | 38.4 /100 | #183 | Fair $60,514 |
| Iraqis | 37.2 /100 | #184 | Fair $60,466 |
| Albanians | 32.0 /100 | #185 | Fair $60,249 |
| Slovenes | 31.8 /100 | #186 | Fair $60,241 |
| Immigrants | Thailand | 31.3 /100 | #187 | Fair $60,217 |
| Immigrants | Eritrea | 28.6 /100 | #188 | Fair $60,096 |
| Ghanaians | 27.5 /100 | #189 | Fair $60,043 |
| Puget Sound Salish | 25.3 /100 | #190 | Fair $59,934 |
| Belgians | 24.9 /100 | #191 | Fair $59,915 |
| South Americans | 23.8 /100 | #192 | Fair $59,854 |
| Immigrants | Costa Rica | 23.6 /100 | #193 | Fair $59,848 |
| Immigrants | Africa | 23.4 /100 | #194 | Fair $59,837 |
| Immigrants | Iraq | 23.2 /100 | #195 | Fair $59,824 |
| Germans | 21.5 /100 | #196 | Fair $59,730 |