Indonesian vs Pueblo Householder Income Ages 25 - 44 years
COMPARE
Indonesian
Pueblo
Householder Income Ages 25 - 44 years
Householder Income Ages 25 - 44 years Comparison
Indonesians
Pueblo
$79,543
HOUSEHOLDER INCOME AGES 25 - 44 YEARS
0.0/ 100
METRIC RATING
311th/ 347
METRIC RANK
$68,910
HOUSEHOLDER INCOME AGES 25 - 44 YEARS
0.0/ 100
METRIC RATING
344th/ 347
METRIC RANK
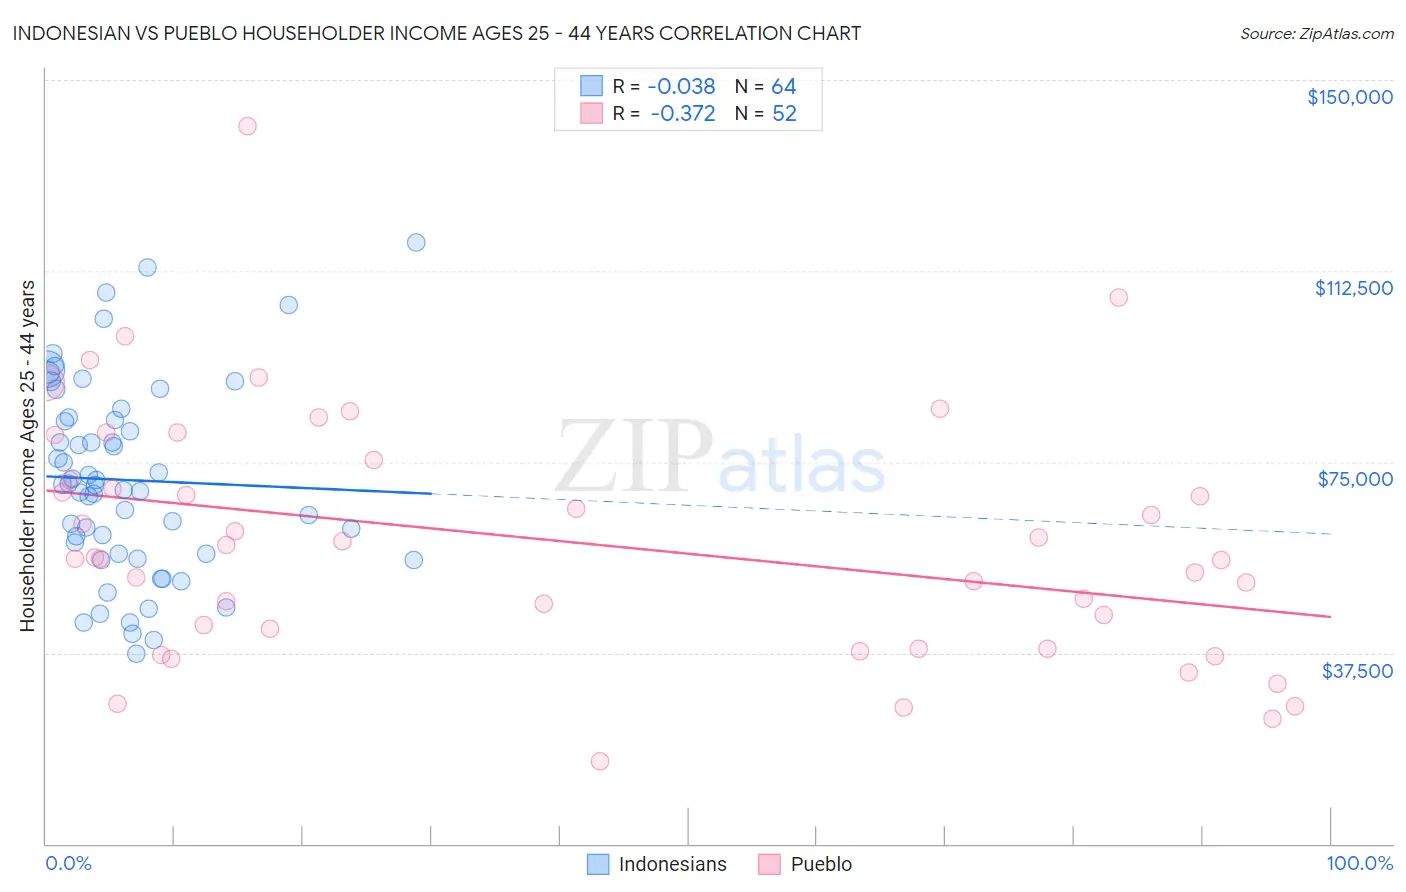
Indonesian vs Pueblo Householder Income Ages 25 - 44 years Correlation Chart
The statistical analysis conducted on geographies consisting of 162,548,199 people shows no correlation between the proportion of Indonesians and household income with householder between the ages 25 and 44 in the United States with a correlation coefficient (R) of -0.038 and weighted average of $79,543. Similarly, the statistical analysis conducted on geographies consisting of 119,922,511 people shows a mild negative correlation between the proportion of Pueblo and household income with householder between the ages 25 and 44 in the United States with a correlation coefficient (R) of -0.372 and weighted average of $68,910, a difference of 15.4%.
Householder Income Ages 25 - 44 years Correlation Summary
| Measurement | Indonesian | Pueblo |
| Minimum | $37,365 | $16,125 |
| Maximum | $118,125 | $140,852 |
| Range | $80,760 | $124,727 |
| Mean | $71,416 | $59,480 |
| Median | $70,496 | $56,103 |
| Interquartile 25% (IQ1) | $56,977 | $40,297 |
| Interquartile 75% (IQ3) | $83,474 | $73,434 |
| Interquartile Range (IQR) | $26,497 | $33,137 |
| Standard Deviation (Sample) | $18,886 | $24,239 |
| Standard Deviation (Population) | $18,738 | $24,005 |
Similar Demographics by Householder Income Ages 25 - 44 years
Demographics Similar to Indonesians by Householder Income Ages 25 - 44 years
In terms of householder income ages 25 - 44 years, the demographic groups most similar to Indonesians are Immigrants from Haiti ($79,391, a difference of 0.19%), Menominee ($79,358, a difference of 0.23%), Cheyenne ($79,152, a difference of 0.49%), Fijian ($79,956, a difference of 0.52%), and Chippewa ($80,005, a difference of 0.58%).
| Demographics | Rating | Rank | Householder Income Ages 25 - 44 years |
| Immigrants | Caribbean | 0.0 /100 | #304 | Tragic $80,326 |
| Immigrants | Dominican Republic | 0.0 /100 | #305 | Tragic $80,319 |
| Apache | 0.0 /100 | #306 | Tragic $80,260 |
| Haitians | 0.0 /100 | #307 | Tragic $80,055 |
| Immigrants | Central America | 0.0 /100 | #308 | Tragic $80,012 |
| Chippewa | 0.0 /100 | #309 | Tragic $80,005 |
| Fijians | 0.0 /100 | #310 | Tragic $79,956 |
| Indonesians | 0.0 /100 | #311 | Tragic $79,543 |
| Immigrants | Haiti | 0.0 /100 | #312 | Tragic $79,391 |
| Menominee | 0.0 /100 | #313 | Tragic $79,358 |
| Cheyenne | 0.0 /100 | #314 | Tragic $79,152 |
| Ottawa | 0.0 /100 | #315 | Tragic $79,012 |
| Africans | 0.0 /100 | #316 | Tragic $78,986 |
| U.S. Virgin Islanders | 0.0 /100 | #317 | Tragic $78,911 |
| Immigrants | Mexico | 0.0 /100 | #318 | Tragic $78,809 |
Demographics Similar to Pueblo by Householder Income Ages 25 - 44 years
In terms of householder income ages 25 - 44 years, the demographic groups most similar to Pueblo are Tohono O'odham ($69,068, a difference of 0.23%), Crow ($71,337, a difference of 3.5%), Navajo ($66,529, a difference of 3.6%), Arapaho ($71,697, a difference of 4.0%), and Puerto Rican ($65,996, a difference of 4.4%).
| Demographics | Rating | Rank | Householder Income Ages 25 - 44 years |
| Hopi | 0.0 /100 | #333 | Tragic $75,002 |
| Creek | 0.0 /100 | #334 | Tragic $74,847 |
| Kiowa | 0.0 /100 | #335 | Tragic $74,776 |
| Yup'ik | 0.0 /100 | #336 | Tragic $73,688 |
| Blacks/African Americans | 0.0 /100 | #337 | Tragic $73,370 |
| Immigrants | Yemen | 0.0 /100 | #338 | Tragic $73,043 |
| Yuman | 0.0 /100 | #339 | Tragic $72,956 |
| Immigrants | Congo | 0.0 /100 | #340 | Tragic $72,178 |
| Arapaho | 0.0 /100 | #341 | Tragic $71,697 |
| Crow | 0.0 /100 | #342 | Tragic $71,337 |
| Tohono O'odham | 0.0 /100 | #343 | Tragic $69,068 |
| Pueblo | 0.0 /100 | #344 | Tragic $68,910 |
| Navajo | 0.0 /100 | #345 | Tragic $66,529 |
| Puerto Ricans | 0.0 /100 | #346 | Tragic $65,996 |
| Lumbee | 0.0 /100 | #347 | Tragic $60,305 |