Indonesian vs Pueblo Per Capita Income
COMPARE
Indonesian
Pueblo
Per Capita Income
Per Capita Income Comparison
Indonesians
Pueblo
$37,300
PER CAPITA INCOME
0.1/ 100
METRIC RATING
296th/ 347
METRIC RANK
$32,012
PER CAPITA INCOME
0.0/ 100
METRIC RATING
339th/ 347
METRIC RANK
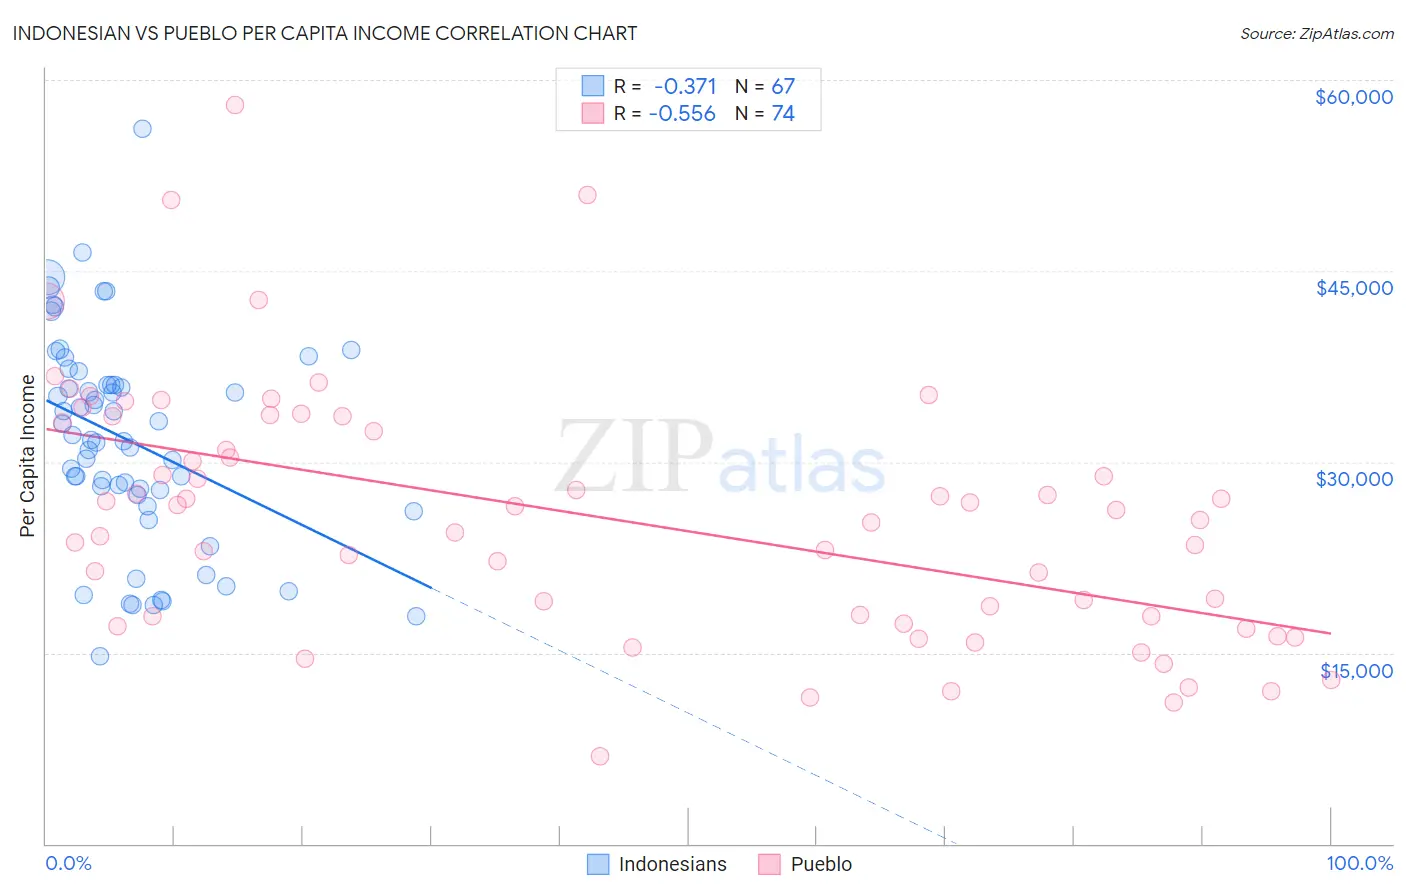
Indonesian vs Pueblo Per Capita Income Correlation Chart
The statistical analysis conducted on geographies consisting of 162,740,842 people shows a mild negative correlation between the proportion of Indonesians and per capita income in the United States with a correlation coefficient (R) of -0.371 and weighted average of $37,300. Similarly, the statistical analysis conducted on geographies consisting of 120,085,924 people shows a substantial negative correlation between the proportion of Pueblo and per capita income in the United States with a correlation coefficient (R) of -0.556 and weighted average of $32,012, a difference of 16.5%.
Per Capita Income Correlation Summary
| Measurement | Indonesian | Pueblo |
| Minimum | $14,779 | $6,914 |
| Maximum | $56,163 | $58,045 |
| Range | $41,384 | $51,131 |
| Mean | $31,679 | $25,689 |
| Median | $31,763 | $25,827 |
| Interquartile 25% (IQ1) | $27,405 | $17,826 |
| Interquartile 75% (IQ3) | $36,017 | $33,050 |
| Interquartile Range (IQR) | $8,612 | $15,224 |
| Standard Deviation (Sample) | $8,209 | $9,930 |
| Standard Deviation (Population) | $8,147 | $9,862 |
Similar Demographics by Per Capita Income
Demographics Similar to Indonesians by Per Capita Income
In terms of per capita income, the demographic groups most similar to Indonesians are Immigrants from Dominican Republic ($37,306, a difference of 0.020%), Haitian ($37,289, a difference of 0.030%), Immigrants from Caribbean ($37,254, a difference of 0.12%), Cuban ($37,383, a difference of 0.22%), and Cherokee ($37,203, a difference of 0.26%).
| Demographics | Rating | Rank | Per Capita Income |
| U.S. Virgin Islanders | 0.1 /100 | #289 | Tragic $37,589 |
| Immigrants | Guatemala | 0.1 /100 | #290 | Tragic $37,550 |
| Cajuns | 0.1 /100 | #291 | Tragic $37,527 |
| Immigrants | Micronesia | 0.1 /100 | #292 | Tragic $37,464 |
| Mexican American Indians | 0.1 /100 | #293 | Tragic $37,407 |
| Cubans | 0.1 /100 | #294 | Tragic $37,383 |
| Immigrants | Dominican Republic | 0.1 /100 | #295 | Tragic $37,306 |
| Indonesians | 0.1 /100 | #296 | Tragic $37,300 |
| Haitians | 0.1 /100 | #297 | Tragic $37,289 |
| Immigrants | Caribbean | 0.1 /100 | #298 | Tragic $37,254 |
| Cherokee | 0.1 /100 | #299 | Tragic $37,203 |
| Immigrants | Bahamas | 0.1 /100 | #300 | Tragic $37,193 |
| Ottawa | 0.1 /100 | #301 | Tragic $37,101 |
| Shoshone | 0.1 /100 | #302 | Tragic $37,072 |
| Paiute | 0.1 /100 | #303 | Tragic $37,066 |
Demographics Similar to Pueblo by Per Capita Income
In terms of per capita income, the demographic groups most similar to Pueblo are Crow ($31,729, a difference of 0.89%), Arapaho ($32,345, a difference of 1.0%), Puerto Rican ($31,268, a difference of 2.4%), Hopi ($31,177, a difference of 2.7%), and Houma ($32,996, a difference of 3.1%).
| Demographics | Rating | Rank | Per Capita Income |
| Sioux | 0.0 /100 | #332 | Tragic $33,921 |
| Immigrants | Yemen | 0.0 /100 | #333 | Tragic $33,696 |
| Natives/Alaskans | 0.0 /100 | #334 | Tragic $33,279 |
| Yuman | 0.0 /100 | #335 | Tragic $33,236 |
| Yakama | 0.0 /100 | #336 | Tragic $33,009 |
| Houma | 0.0 /100 | #337 | Tragic $32,996 |
| Arapaho | 0.0 /100 | #338 | Tragic $32,345 |
| Pueblo | 0.0 /100 | #339 | Tragic $32,012 |
| Crow | 0.0 /100 | #340 | Tragic $31,729 |
| Puerto Ricans | 0.0 /100 | #341 | Tragic $31,268 |
| Hopi | 0.0 /100 | #342 | Tragic $31,177 |
| Pima | 0.0 /100 | #343 | Tragic $30,644 |
| Yup'ik | 0.0 /100 | #344 | Tragic $30,518 |
| Tohono O'odham | 0.0 /100 | #345 | Tragic $30,256 |
| Lumbee | 0.0 /100 | #346 | Tragic $29,845 |