Slovene vs Pueblo Householder Income Ages 25 - 44 years
COMPARE
Slovene
Pueblo
Householder Income Ages 25 - 44 years
Householder Income Ages 25 - 44 years Comparison
Slovenes
Pueblo
$96,439
HOUSEHOLDER INCOME AGES 25 - 44 YEARS
73.9/ 100
METRIC RATING
153rd/ 347
METRIC RANK
$68,910
HOUSEHOLDER INCOME AGES 25 - 44 YEARS
0.0/ 100
METRIC RATING
344th/ 347
METRIC RANK
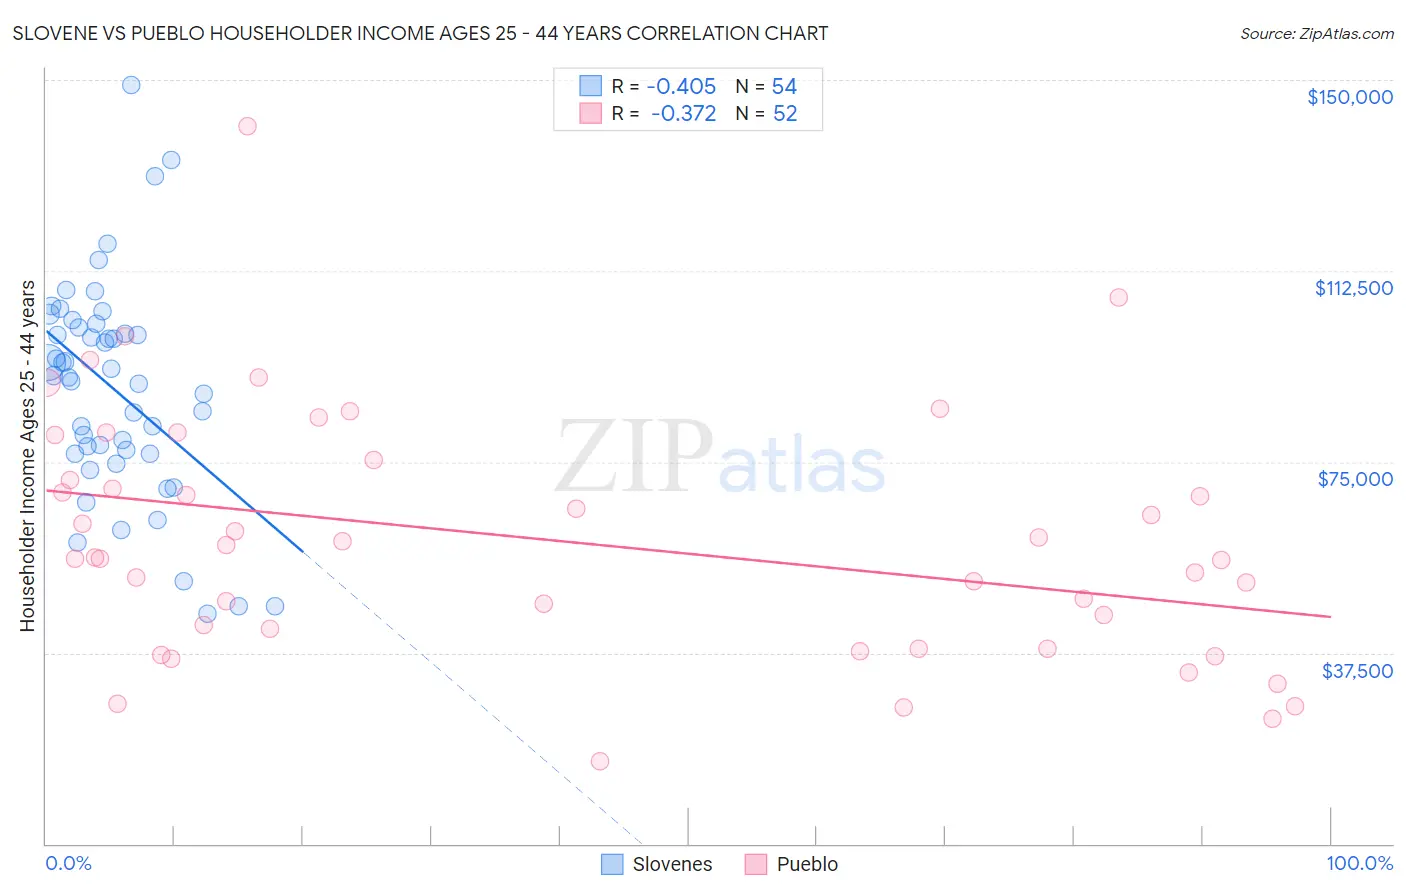
Slovene vs Pueblo Householder Income Ages 25 - 44 years Correlation Chart
The statistical analysis conducted on geographies consisting of 260,772,940 people shows a moderate negative correlation between the proportion of Slovenes and household income with householder between the ages 25 and 44 in the United States with a correlation coefficient (R) of -0.405 and weighted average of $96,439. Similarly, the statistical analysis conducted on geographies consisting of 119,922,511 people shows a mild negative correlation between the proportion of Pueblo and household income with householder between the ages 25 and 44 in the United States with a correlation coefficient (R) of -0.372 and weighted average of $68,910, a difference of 40.0%.
Householder Income Ages 25 - 44 years Correlation Summary
| Measurement | Slovene | Pueblo |
| Minimum | $45,114 | $16,125 |
| Maximum | $149,005 | $140,852 |
| Range | $103,891 | $124,727 |
| Mean | $89,263 | $59,480 |
| Median | $91,712 | $56,103 |
| Interquartile 25% (IQ1) | $76,661 | $40,297 |
| Interquartile 75% (IQ3) | $101,430 | $73,434 |
| Interquartile Range (IQR) | $24,769 | $33,137 |
| Standard Deviation (Sample) | $21,285 | $24,239 |
| Standard Deviation (Population) | $21,087 | $24,005 |
Similar Demographics by Householder Income Ages 25 - 44 years
Demographics Similar to Slovenes by Householder Income Ages 25 - 44 years
In terms of householder income ages 25 - 44 years, the demographic groups most similar to Slovenes are South American Indian ($96,497, a difference of 0.060%), Slavic ($96,377, a difference of 0.060%), Czech ($96,525, a difference of 0.090%), Ugandan ($96,667, a difference of 0.24%), and Basque ($96,709, a difference of 0.28%).
| Demographics | Rating | Rank | Householder Income Ages 25 - 44 years |
| Ethiopians | 77.8 /100 | #146 | Good $96,824 |
| Immigrants | Syria | 77.4 /100 | #147 | Good $96,789 |
| Irish | 76.9 /100 | #148 | Good $96,730 |
| Basques | 76.6 /100 | #149 | Good $96,709 |
| Ugandans | 76.2 /100 | #150 | Good $96,667 |
| Czechs | 74.8 /100 | #151 | Good $96,525 |
| South American Indians | 74.5 /100 | #152 | Good $96,497 |
| Slovenes | 73.9 /100 | #153 | Good $96,439 |
| Slavs | 73.2 /100 | #154 | Good $96,377 |
| Moroccans | 70.3 /100 | #155 | Good $96,117 |
| Immigrants | Germany | 67.9 /100 | #156 | Good $95,913 |
| Immigrants | Uganda | 65.2 /100 | #157 | Good $95,698 |
| Scandinavians | 63.9 /100 | #158 | Good $95,596 |
| Costa Ricans | 63.5 /100 | #159 | Good $95,565 |
| Icelanders | 63.4 /100 | #160 | Good $95,560 |
Demographics Similar to Pueblo by Householder Income Ages 25 - 44 years
In terms of householder income ages 25 - 44 years, the demographic groups most similar to Pueblo are Tohono O'odham ($69,068, a difference of 0.23%), Crow ($71,337, a difference of 3.5%), Navajo ($66,529, a difference of 3.6%), Arapaho ($71,697, a difference of 4.0%), and Puerto Rican ($65,996, a difference of 4.4%).
| Demographics | Rating | Rank | Householder Income Ages 25 - 44 years |
| Hopi | 0.0 /100 | #333 | Tragic $75,002 |
| Creek | 0.0 /100 | #334 | Tragic $74,847 |
| Kiowa | 0.0 /100 | #335 | Tragic $74,776 |
| Yup'ik | 0.0 /100 | #336 | Tragic $73,688 |
| Blacks/African Americans | 0.0 /100 | #337 | Tragic $73,370 |
| Immigrants | Yemen | 0.0 /100 | #338 | Tragic $73,043 |
| Yuman | 0.0 /100 | #339 | Tragic $72,956 |
| Immigrants | Congo | 0.0 /100 | #340 | Tragic $72,178 |
| Arapaho | 0.0 /100 | #341 | Tragic $71,697 |
| Crow | 0.0 /100 | #342 | Tragic $71,337 |
| Tohono O'odham | 0.0 /100 | #343 | Tragic $69,068 |
| Pueblo | 0.0 /100 | #344 | Tragic $68,910 |
| Navajo | 0.0 /100 | #345 | Tragic $66,529 |
| Puerto Ricans | 0.0 /100 | #346 | Tragic $65,996 |
| Lumbee | 0.0 /100 | #347 | Tragic $60,305 |