Indonesian vs Yakama Householder Income Ages 25 - 44 years
COMPARE
Indonesian
Yakama
Householder Income Ages 25 - 44 years
Householder Income Ages 25 - 44 years Comparison
Indonesians
Yakama
$79,543
HOUSEHOLDER INCOME AGES 25 - 44 YEARS
0.0/ 100
METRIC RATING
311th/ 347
METRIC RANK
$76,226
HOUSEHOLDER INCOME AGES 25 - 44 YEARS
0.0/ 100
METRIC RATING
330th/ 347
METRIC RANK
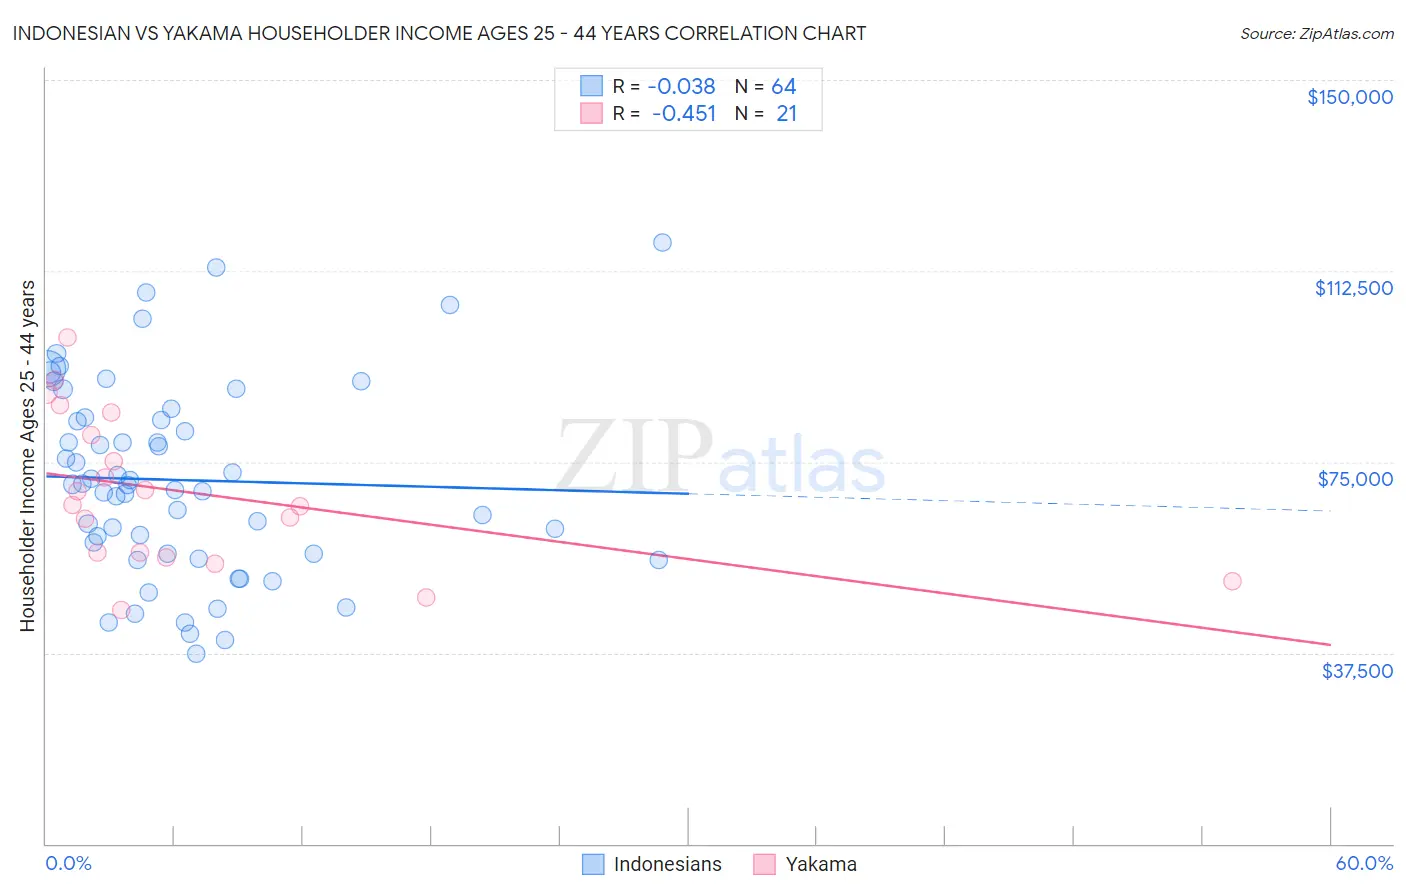
Indonesian vs Yakama Householder Income Ages 25 - 44 years Correlation Chart
The statistical analysis conducted on geographies consisting of 162,548,199 people shows no correlation between the proportion of Indonesians and household income with householder between the ages 25 and 44 in the United States with a correlation coefficient (R) of -0.038 and weighted average of $79,543. Similarly, the statistical analysis conducted on geographies consisting of 19,902,143 people shows a moderate negative correlation between the proportion of Yakama and household income with householder between the ages 25 and 44 in the United States with a correlation coefficient (R) of -0.451 and weighted average of $76,226, a difference of 4.3%.
Householder Income Ages 25 - 44 years Correlation Summary
| Measurement | Indonesian | Yakama |
| Minimum | $37,365 | $45,972 |
| Maximum | $118,125 | $99,532 |
| Range | $80,760 | $53,560 |
| Mean | $71,416 | $68,963 |
| Median | $70,496 | $66,512 |
| Interquartile 25% (IQ1) | $56,977 | $56,733 |
| Interquartile 75% (IQ3) | $83,474 | $82,417 |
| Interquartile Range (IQR) | $26,497 | $25,684 |
| Standard Deviation (Sample) | $18,886 | $14,961 |
| Standard Deviation (Population) | $18,738 | $14,600 |
Demographics Similar to Indonesians and Yakama by Householder Income Ages 25 - 44 years
In terms of householder income ages 25 - 44 years, the demographic groups most similar to Indonesians are Immigrants from Haiti ($79,391, a difference of 0.19%), Menominee ($79,358, a difference of 0.23%), Cheyenne ($79,152, a difference of 0.49%), Fijian ($79,956, a difference of 0.52%), and Ottawa ($79,012, a difference of 0.67%). Similarly, the demographic groups most similar to Yakama are Seminole ($76,584, a difference of 0.47%), Immigrants from Cuba ($76,701, a difference of 0.62%), Immigrants from Bahamas ($76,910, a difference of 0.90%), Houma ($77,044, a difference of 1.1%), and Sioux ($77,089, a difference of 1.1%).
| Demographics | Rating | Rank | Householder Income Ages 25 - 44 years |
| Fijians | 0.0 /100 | #310 | Tragic $79,956 |
| Indonesians | 0.0 /100 | #311 | Tragic $79,543 |
| Immigrants | Haiti | 0.0 /100 | #312 | Tragic $79,391 |
| Menominee | 0.0 /100 | #313 | Tragic $79,358 |
| Cheyenne | 0.0 /100 | #314 | Tragic $79,152 |
| Ottawa | 0.0 /100 | #315 | Tragic $79,012 |
| Africans | 0.0 /100 | #316 | Tragic $78,986 |
| U.S. Virgin Islanders | 0.0 /100 | #317 | Tragic $78,911 |
| Immigrants | Mexico | 0.0 /100 | #318 | Tragic $78,809 |
| Hondurans | 0.0 /100 | #319 | Tragic $78,540 |
| Choctaw | 0.0 /100 | #320 | Tragic $78,168 |
| Immigrants | Zaire | 0.0 /100 | #321 | Tragic $78,045 |
| Chickasaw | 0.0 /100 | #322 | Tragic $77,929 |
| Immigrants | Honduras | 0.0 /100 | #323 | Tragic $77,328 |
| Dutch West Indians | 0.0 /100 | #324 | Tragic $77,260 |
| Sioux | 0.0 /100 | #325 | Tragic $77,089 |
| Houma | 0.0 /100 | #326 | Tragic $77,044 |
| Immigrants | Bahamas | 0.0 /100 | #327 | Tragic $76,910 |
| Immigrants | Cuba | 0.0 /100 | #328 | Tragic $76,701 |
| Seminole | 0.0 /100 | #329 | Tragic $76,584 |
| Yakama | 0.0 /100 | #330 | Tragic $76,226 |