Immigrants from Kenya vs Immigrants from Nigeria Householder Income Ages 25 - 44 years
COMPARE
Immigrants from Kenya
Immigrants from Nigeria
Householder Income Ages 25 - 44 years
Householder Income Ages 25 - 44 years Comparison
Immigrants from Kenya
Immigrants from Nigeria
$90,767
HOUSEHOLDER INCOME AGES 25 - 44 YEARS
10.9/ 100
METRIC RATING
210th/ 347
METRIC RANK
$86,589
HOUSEHOLDER INCOME AGES 25 - 44 YEARS
1.2/ 100
METRIC RATING
247th/ 347
METRIC RANK
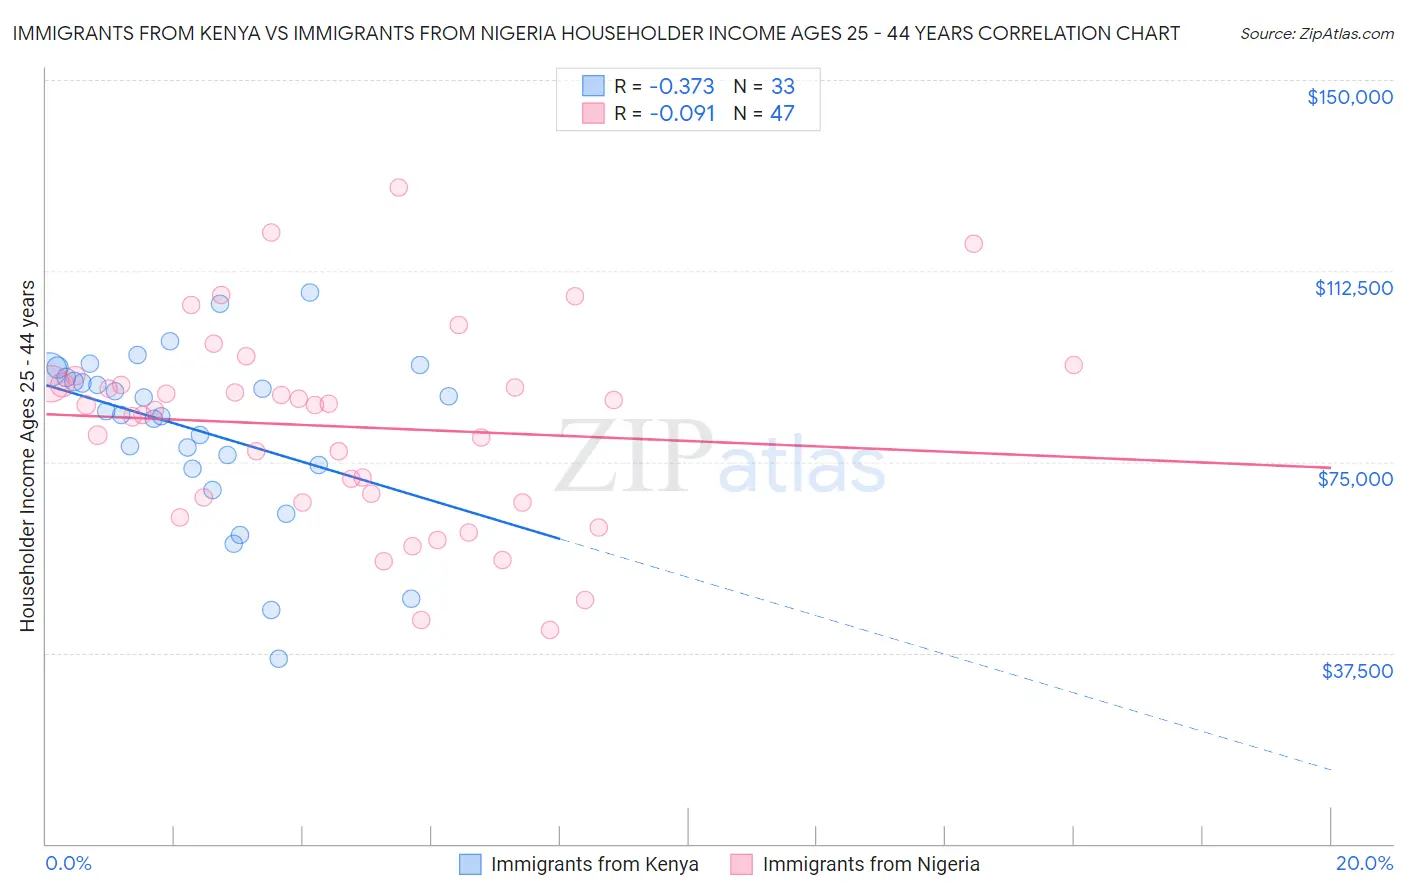
Immigrants from Kenya vs Immigrants from Nigeria Householder Income Ages 25 - 44 years Correlation Chart
The statistical analysis conducted on geographies consisting of 217,833,314 people shows a mild negative correlation between the proportion of Immigrants from Kenya and household income with householder between the ages 25 and 44 in the United States with a correlation coefficient (R) of -0.373 and weighted average of $90,767. Similarly, the statistical analysis conducted on geographies consisting of 283,094,597 people shows a slight negative correlation between the proportion of Immigrants from Nigeria and household income with householder between the ages 25 and 44 in the United States with a correlation coefficient (R) of -0.091 and weighted average of $86,589, a difference of 4.8%.
Householder Income Ages 25 - 44 years Correlation Summary
| Measurement | Immigrants from Kenya | Immigrants from Nigeria |
| Minimum | $36,409 | $42,092 |
| Maximum | $108,304 | $128,882 |
| Range | $71,895 | $86,790 |
| Mean | $81,270 | $81,924 |
| Median | $85,004 | $86,086 |
| Interquartile 25% (IQ1) | $73,989 | $67,086 |
| Interquartile 75% (IQ3) | $92,370 | $90,392 |
| Interquartile Range (IQR) | $18,381 | $23,305 |
| Standard Deviation (Sample) | $16,718 | $19,417 |
| Standard Deviation (Population) | $16,463 | $19,209 |
Similar Demographics by Householder Income Ages 25 - 44 years
Demographics Similar to Immigrants from Kenya by Householder Income Ages 25 - 44 years
In terms of householder income ages 25 - 44 years, the demographic groups most similar to Immigrants from Kenya are Iraqi ($90,764, a difference of 0.0%), Hawaiian ($90,722, a difference of 0.050%), Immigrants from Bangladesh ($90,448, a difference of 0.35%), Immigrants from Africa ($90,372, a difference of 0.44%), and Immigrants from Uruguay ($91,171, a difference of 0.45%).
| Demographics | Rating | Rank | Householder Income Ages 25 - 44 years |
| Immigrants | Cambodia | 15.7 /100 | #203 | Poor $91,533 |
| Nepalese | 15.4 /100 | #204 | Poor $91,498 |
| Immigrants | Eastern Africa | 15.2 /100 | #205 | Poor $91,458 |
| Aleuts | 14.5 /100 | #206 | Poor $91,370 |
| Yugoslavians | 14.5 /100 | #207 | Poor $91,368 |
| Immigrants | Thailand | 14.3 /100 | #208 | Poor $91,337 |
| Immigrants | Uruguay | 13.2 /100 | #209 | Poor $91,171 |
| Immigrants | Kenya | 10.9 /100 | #210 | Poor $90,767 |
| Iraqis | 10.8 /100 | #211 | Poor $90,764 |
| Hawaiians | 10.6 /100 | #212 | Poor $90,722 |
| Immigrants | Bangladesh | 9.3 /100 | #213 | Tragic $90,448 |
| Immigrants | Africa | 8.9 /100 | #214 | Tragic $90,372 |
| Panamanians | 8.1 /100 | #215 | Tragic $90,193 |
| Ghanaians | 7.9 /100 | #216 | Tragic $90,137 |
| Scotch-Irish | 7.3 /100 | #217 | Tragic $89,969 |
Demographics Similar to Immigrants from Nigeria by Householder Income Ages 25 - 44 years
In terms of householder income ages 25 - 44 years, the demographic groups most similar to Immigrants from Nigeria are Immigrants from Burma/Myanmar ($86,736, a difference of 0.17%), Immigrants from El Salvador ($86,913, a difference of 0.37%), Immigrants from Venezuela ($87,038, a difference of 0.52%), Immigrants from West Indies ($87,063, a difference of 0.55%), and Immigrants from Sudan ($86,109, a difference of 0.56%).
| Demographics | Rating | Rank | Householder Income Ages 25 - 44 years |
| Nicaraguans | 2.2 /100 | #240 | Tragic $87,751 |
| Nigerians | 2.2 /100 | #241 | Tragic $87,730 |
| West Indians | 1.7 /100 | #242 | Tragic $87,205 |
| Immigrants | West Indies | 1.5 /100 | #243 | Tragic $87,063 |
| Immigrants | Venezuela | 1.5 /100 | #244 | Tragic $87,038 |
| Immigrants | El Salvador | 1.4 /100 | #245 | Tragic $86,913 |
| Immigrants | Burma/Myanmar | 1.3 /100 | #246 | Tragic $86,736 |
| Immigrants | Nigeria | 1.2 /100 | #247 | Tragic $86,589 |
| Immigrants | Sudan | 0.9 /100 | #248 | Tragic $86,109 |
| French American Indians | 0.8 /100 | #249 | Tragic $85,899 |
| Pennsylvania Germans | 0.8 /100 | #250 | Tragic $85,836 |
| Cape Verdeans | 0.8 /100 | #251 | Tragic $85,758 |
| Immigrants | Western Africa | 0.7 /100 | #252 | Tragic $85,676 |
| British West Indians | 0.7 /100 | #253 | Tragic $85,565 |
| Immigrants | Laos | 0.7 /100 | #254 | Tragic $85,553 |