Senegalese vs Haitian Householder Income Ages 45 - 64 years
COMPARE
Senegalese
Haitian
Householder Income Ages 45 - 64 years
Householder Income Ages 45 - 64 years Comparison
Senegalese
Haitians
$86,897
HOUSEHOLDER INCOME AGES 45 - 64 YEARS
0.1/ 100
METRIC RATING
282nd/ 347
METRIC RANK
$84,384
HOUSEHOLDER INCOME AGES 45 - 64 YEARS
0.0/ 100
METRIC RATING
302nd/ 347
METRIC RANK
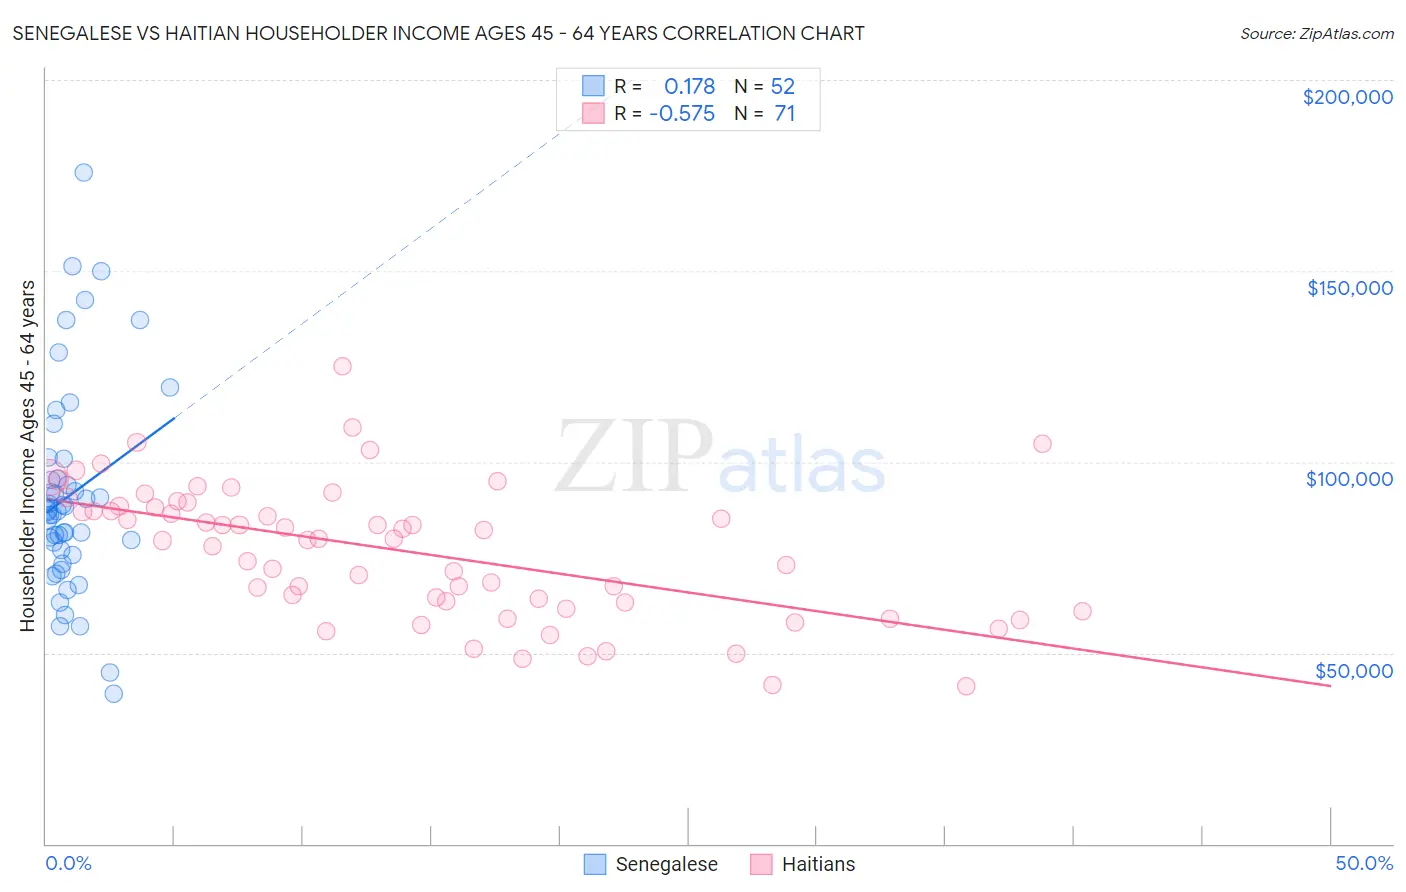
Senegalese vs Haitian Householder Income Ages 45 - 64 years Correlation Chart
The statistical analysis conducted on geographies consisting of 78,071,006 people shows a poor positive correlation between the proportion of Senegalese and household income with householder between the ages 45 and 64 in the United States with a correlation coefficient (R) of 0.178 and weighted average of $86,897. Similarly, the statistical analysis conducted on geographies consisting of 287,353,050 people shows a substantial negative correlation between the proportion of Haitians and household income with householder between the ages 45 and 64 in the United States with a correlation coefficient (R) of -0.575 and weighted average of $84,384, a difference of 3.0%.
Householder Income Ages 45 - 64 years Correlation Summary
| Measurement | Senegalese | Haitian |
| Minimum | $39,353 | $41,306 |
| Maximum | $175,761 | $125,012 |
| Range | $136,408 | $83,706 |
| Mean | $91,310 | $76,677 |
| Median | $87,120 | $79,782 |
| Interquartile 25% (IQ1) | $76,238 | $63,219 |
| Interquartile 75% (IQ3) | $98,209 | $88,532 |
| Interquartile Range (IQR) | $21,971 | $25,313 |
| Standard Deviation (Sample) | $27,351 | $17,503 |
| Standard Deviation (Population) | $27,087 | $17,379 |
Demographics Similar to Senegalese and Haitians by Householder Income Ages 45 - 64 years
In terms of householder income ages 45 - 64 years, the demographic groups most similar to Senegalese are Mexican ($86,816, a difference of 0.090%), Central American Indian ($86,764, a difference of 0.15%), Blackfeet ($86,595, a difference of 0.35%), Immigrants from Guatemala ($86,573, a difference of 0.37%), and Bangladeshi ($86,402, a difference of 0.57%). Similarly, the demographic groups most similar to Haitians are Potawatomi ($84,613, a difference of 0.27%), Indonesian ($84,890, a difference of 0.60%), Immigrants from Mexico ($84,910, a difference of 0.62%), African ($84,925, a difference of 0.64%), and Fijian ($85,187, a difference of 0.95%).
| Demographics | Rating | Rank | Householder Income Ages 45 - 64 years |
| Senegalese | 0.1 /100 | #282 | Tragic $86,897 |
| Mexicans | 0.1 /100 | #283 | Tragic $86,816 |
| Central American Indians | 0.1 /100 | #284 | Tragic $86,764 |
| Blackfeet | 0.1 /100 | #285 | Tragic $86,595 |
| Immigrants | Guatemala | 0.1 /100 | #286 | Tragic $86,573 |
| Bangladeshis | 0.1 /100 | #287 | Tragic $86,402 |
| Immigrants | St. Vincent and the Grenadines | 0.1 /100 | #288 | Tragic $86,394 |
| Cubans | 0.1 /100 | #289 | Tragic $86,301 |
| Cherokee | 0.1 /100 | #290 | Tragic $86,125 |
| Hispanics or Latinos | 0.1 /100 | #291 | Tragic $86,006 |
| Immigrants | Central America | 0.1 /100 | #292 | Tragic $85,965 |
| Comanche | 0.1 /100 | #293 | Tragic $85,787 |
| British West Indians | 0.1 /100 | #294 | Tragic $85,571 |
| Immigrants | Grenada | 0.1 /100 | #295 | Tragic $85,552 |
| Immigrants | Zaire | 0.1 /100 | #296 | Tragic $85,207 |
| Fijians | 0.1 /100 | #297 | Tragic $85,187 |
| Africans | 0.0 /100 | #298 | Tragic $84,925 |
| Immigrants | Mexico | 0.0 /100 | #299 | Tragic $84,910 |
| Indonesians | 0.0 /100 | #300 | Tragic $84,890 |
| Potawatomi | 0.0 /100 | #301 | Tragic $84,613 |
| Haitians | 0.0 /100 | #302 | Tragic $84,384 |