English vs Haitian Householder Income Ages 45 - 64 years
COMPARE
English
Haitian
Householder Income Ages 45 - 64 years
Householder Income Ages 45 - 64 years Comparison
English
Haitians
$102,021
HOUSEHOLDER INCOME AGES 45 - 64 YEARS
70.1/ 100
METRIC RATING
163rd/ 347
METRIC RANK
$84,384
HOUSEHOLDER INCOME AGES 45 - 64 YEARS
0.0/ 100
METRIC RATING
302nd/ 347
METRIC RANK
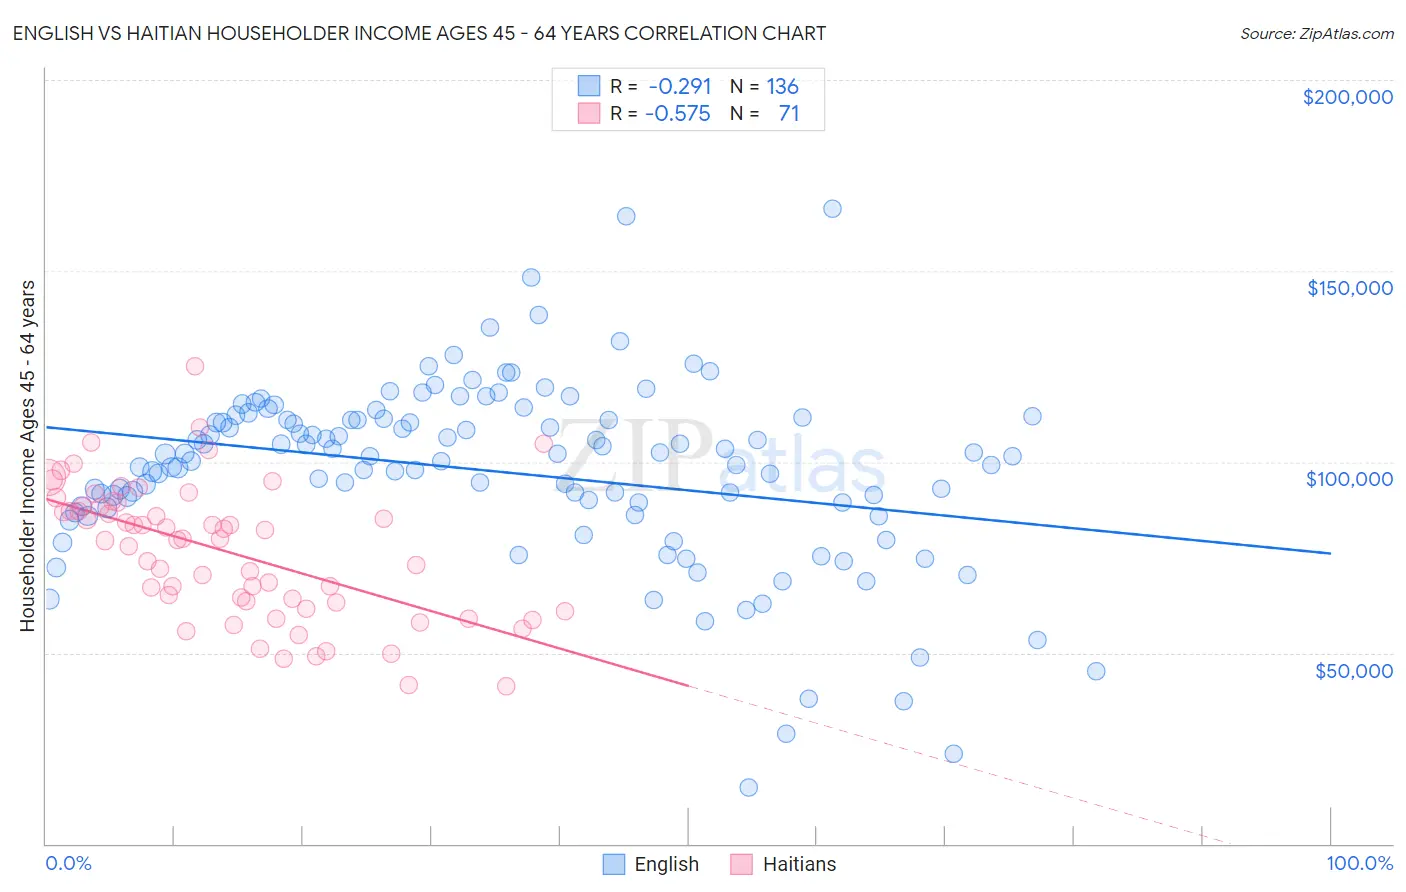
English vs Haitian Householder Income Ages 45 - 64 years Correlation Chart
The statistical analysis conducted on geographies consisting of 574,771,761 people shows a weak negative correlation between the proportion of English and household income with householder between the ages 45 and 64 in the United States with a correlation coefficient (R) of -0.291 and weighted average of $102,021. Similarly, the statistical analysis conducted on geographies consisting of 287,353,050 people shows a substantial negative correlation between the proportion of Haitians and household income with householder between the ages 45 and 64 in the United States with a correlation coefficient (R) of -0.575 and weighted average of $84,384, a difference of 20.9%.
Householder Income Ages 45 - 64 years Correlation Summary
| Measurement | English | Haitian |
| Minimum | $14,575 | $41,306 |
| Maximum | $166,250 | $125,012 |
| Range | $151,675 | $83,706 |
| Mean | $97,518 | $76,677 |
| Median | $101,539 | $79,782 |
| Interquartile 25% (IQ1) | $88,185 | $63,219 |
| Interquartile 75% (IQ3) | $111,242 | $88,532 |
| Interquartile Range (IQR) | $23,057 | $25,313 |
| Standard Deviation (Sample) | $24,105 | $17,503 |
| Standard Deviation (Population) | $24,016 | $17,379 |
Similar Demographics by Householder Income Ages 45 - 64 years
Demographics Similar to English by Householder Income Ages 45 - 64 years
In terms of householder income ages 45 - 64 years, the demographic groups most similar to English are Immigrants from Morocco ($102,015, a difference of 0.010%), Immigrants from Albania ($101,957, a difference of 0.060%), Scottish ($102,123, a difference of 0.10%), Immigrants from Nepal ($102,190, a difference of 0.17%), and Icelander ($102,261, a difference of 0.24%).
| Demographics | Rating | Rank | Householder Income Ages 45 - 64 years |
| Carpatho Rusyns | 77.4 /100 | #156 | Good $102,777 |
| Immigrants | Ethiopia | 77.3 /100 | #157 | Good $102,763 |
| Slavs | 76.1 /100 | #158 | Good $102,629 |
| Sierra Leoneans | 74.2 /100 | #159 | Good $102,427 |
| Icelanders | 72.5 /100 | #160 | Good $102,261 |
| Immigrants | Nepal | 71.8 /100 | #161 | Good $102,190 |
| Scottish | 71.1 /100 | #162 | Good $102,123 |
| English | 70.1 /100 | #163 | Good $102,021 |
| Immigrants | Morocco | 70.0 /100 | #164 | Good $102,015 |
| Immigrants | Albania | 69.4 /100 | #165 | Good $101,957 |
| Samoans | 65.3 /100 | #166 | Good $101,580 |
| Czechoslovakians | 63.0 /100 | #167 | Good $101,387 |
| South American Indians | 60.5 /100 | #168 | Good $101,171 |
| Guamanians/Chamorros | 60.5 /100 | #169 | Good $101,170 |
| Slovaks | 58.8 /100 | #170 | Average $101,029 |
Demographics Similar to Haitians by Householder Income Ages 45 - 64 years
In terms of householder income ages 45 - 64 years, the demographic groups most similar to Haitians are Potawatomi ($84,613, a difference of 0.27%), Honduran ($84,079, a difference of 0.36%), Ottawa ($83,953, a difference of 0.51%), Chippewa ($83,943, a difference of 0.52%), and Ute ($83,937, a difference of 0.53%).
| Demographics | Rating | Rank | Householder Income Ages 45 - 64 years |
| Immigrants | Grenada | 0.1 /100 | #295 | Tragic $85,552 |
| Immigrants | Zaire | 0.1 /100 | #296 | Tragic $85,207 |
| Fijians | 0.1 /100 | #297 | Tragic $85,187 |
| Africans | 0.0 /100 | #298 | Tragic $84,925 |
| Immigrants | Mexico | 0.0 /100 | #299 | Tragic $84,910 |
| Indonesians | 0.0 /100 | #300 | Tragic $84,890 |
| Potawatomi | 0.0 /100 | #301 | Tragic $84,613 |
| Haitians | 0.0 /100 | #302 | Tragic $84,384 |
| Hondurans | 0.0 /100 | #303 | Tragic $84,079 |
| Ottawa | 0.0 /100 | #304 | Tragic $83,953 |
| Chippewa | 0.0 /100 | #305 | Tragic $83,943 |
| Ute | 0.0 /100 | #306 | Tragic $83,937 |
| Shoshone | 0.0 /100 | #307 | Tragic $83,588 |
| Immigrants | Cabo Verde | 0.0 /100 | #308 | Tragic $83,542 |
| Immigrants | Dominica | 0.0 /100 | #309 | Tragic $83,311 |