Immigrants from Eastern Europe vs Eastern European Per Capita Income
COMPARE
Immigrants from Eastern Europe
Eastern European
Per Capita Income
Per Capita Income Comparison
Immigrants from Eastern Europe
Eastern Europeans
$49,316
PER CAPITA INCOME
99.8/ 100
METRIC RATING
70th/ 347
METRIC RANK
$55,780
PER CAPITA INCOME
100.0/ 100
METRIC RATING
11th/ 347
METRIC RANK
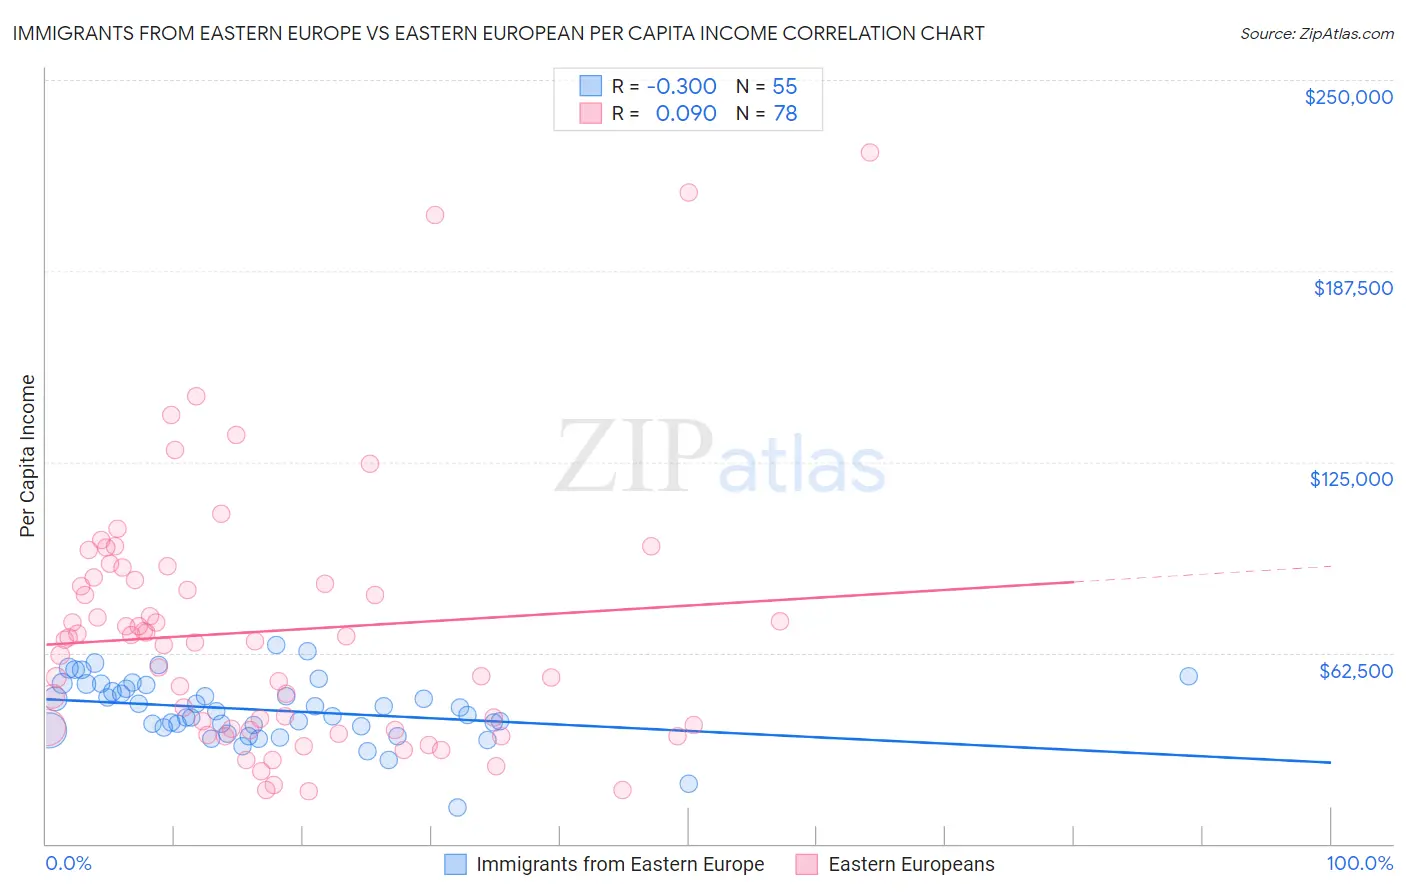
Immigrants from Eastern Europe vs Eastern European Per Capita Income Correlation Chart
The statistical analysis conducted on geographies consisting of 475,909,119 people shows a mild negative correlation between the proportion of Immigrants from Eastern Europe and per capita income in the United States with a correlation coefficient (R) of -0.300 and weighted average of $49,316. Similarly, the statistical analysis conducted on geographies consisting of 461,273,443 people shows a slight positive correlation between the proportion of Eastern Europeans and per capita income in the United States with a correlation coefficient (R) of 0.090 and weighted average of $55,780, a difference of 13.1%.
Per Capita Income Correlation Summary
| Measurement | Immigrants from Eastern Europe | Eastern European |
| Minimum | $11,876 | $17,105 |
| Maximum | $65,115 | $226,072 |
| Range | $53,239 | $208,967 |
| Mean | $43,803 | $69,550 |
| Median | $43,497 | $66,546 |
| Interquartile 25% (IQ1) | $38,232 | $37,574 |
| Interquartile 75% (IQ3) | $52,105 | $86,383 |
| Interquartile Range (IQR) | $13,872 | $48,809 |
| Standard Deviation (Sample) | $10,236 | $42,028 |
| Standard Deviation (Population) | $10,143 | $41,758 |
Similar Demographics by Per Capita Income
Demographics Similar to Immigrants from Eastern Europe by Per Capita Income
In terms of per capita income, the demographic groups most similar to Immigrants from Eastern Europe are Greek ($49,309, a difference of 0.010%), Immigrants from Hungary ($49,303, a difference of 0.030%), Immigrants from North America ($49,302, a difference of 0.030%), Immigrants from Canada ($49,412, a difference of 0.20%), and Lithuanian ($49,448, a difference of 0.27%).
| Demographics | Rating | Rank | Per Capita Income |
| Maltese | 99.9 /100 | #63 | Exceptional $49,640 |
| Immigrants | Argentina | 99.9 /100 | #64 | Exceptional $49,627 |
| Bolivians | 99.9 /100 | #65 | Exceptional $49,526 |
| Immigrants | Bulgaria | 99.9 /100 | #66 | Exceptional $49,482 |
| Immigrants | Romania | 99.9 /100 | #67 | Exceptional $49,463 |
| Lithuanians | 99.8 /100 | #68 | Exceptional $49,448 |
| Immigrants | Canada | 99.8 /100 | #69 | Exceptional $49,412 |
| Immigrants | Eastern Europe | 99.8 /100 | #70 | Exceptional $49,316 |
| Greeks | 99.8 /100 | #71 | Exceptional $49,309 |
| Immigrants | Hungary | 99.8 /100 | #72 | Exceptional $49,303 |
| Immigrants | North America | 99.8 /100 | #73 | Exceptional $49,302 |
| Mongolians | 99.8 /100 | #74 | Exceptional $49,173 |
| Immigrants | Bolivia | 99.7 /100 | #75 | Exceptional $48,970 |
| Immigrants | England | 99.7 /100 | #76 | Exceptional $48,844 |
| Immigrants | Kazakhstan | 99.7 /100 | #77 | Exceptional $48,747 |
Demographics Similar to Eastern Europeans by Per Capita Income
In terms of per capita income, the demographic groups most similar to Eastern Europeans are Okinawan ($55,817, a difference of 0.070%), Immigrants from Sweden ($55,582, a difference of 0.36%), Immigrants from India ($55,268, a difference of 0.93%), Immigrants from Belgium ($55,082, a difference of 1.3%), and Immigrants from Ireland ($56,584, a difference of 1.4%).
| Demographics | Rating | Rank | Per Capita Income |
| Immigrants | Australia | 100.0 /100 | #4 | Exceptional $57,953 |
| Immigrants | Iran | 100.0 /100 | #5 | Exceptional $57,759 |
| Immigrants | Taiwan | 100.0 /100 | #6 | Exceptional $57,742 |
| Immigrants | Israel | 100.0 /100 | #7 | Exceptional $57,384 |
| Immigrants | Hong Kong | 100.0 /100 | #8 | Exceptional $56,709 |
| Immigrants | Ireland | 100.0 /100 | #9 | Exceptional $56,584 |
| Okinawans | 100.0 /100 | #10 | Exceptional $55,817 |
| Eastern Europeans | 100.0 /100 | #11 | Exceptional $55,780 |
| Immigrants | Sweden | 100.0 /100 | #12 | Exceptional $55,582 |
| Immigrants | India | 100.0 /100 | #13 | Exceptional $55,268 |
| Immigrants | Belgium | 100.0 /100 | #14 | Exceptional $55,082 |
| Cypriots | 100.0 /100 | #15 | Exceptional $54,899 |
| Immigrants | Switzerland | 100.0 /100 | #16 | Exceptional $54,866 |
| Immigrants | France | 100.0 /100 | #17 | Exceptional $54,557 |
| Thais | 100.0 /100 | #18 | Exceptional $54,307 |