Immigrants from Netherlands vs Eastern European Per Capita Income
COMPARE
Immigrants from Netherlands
Eastern European
Per Capita Income
Per Capita Income Comparison
Immigrants from Netherlands
Eastern Europeans
$50,458
PER CAPITA INCOME
100.0/ 100
METRIC RATING
51st/ 347
METRIC RANK
$55,780
PER CAPITA INCOME
100.0/ 100
METRIC RATING
11th/ 347
METRIC RANK
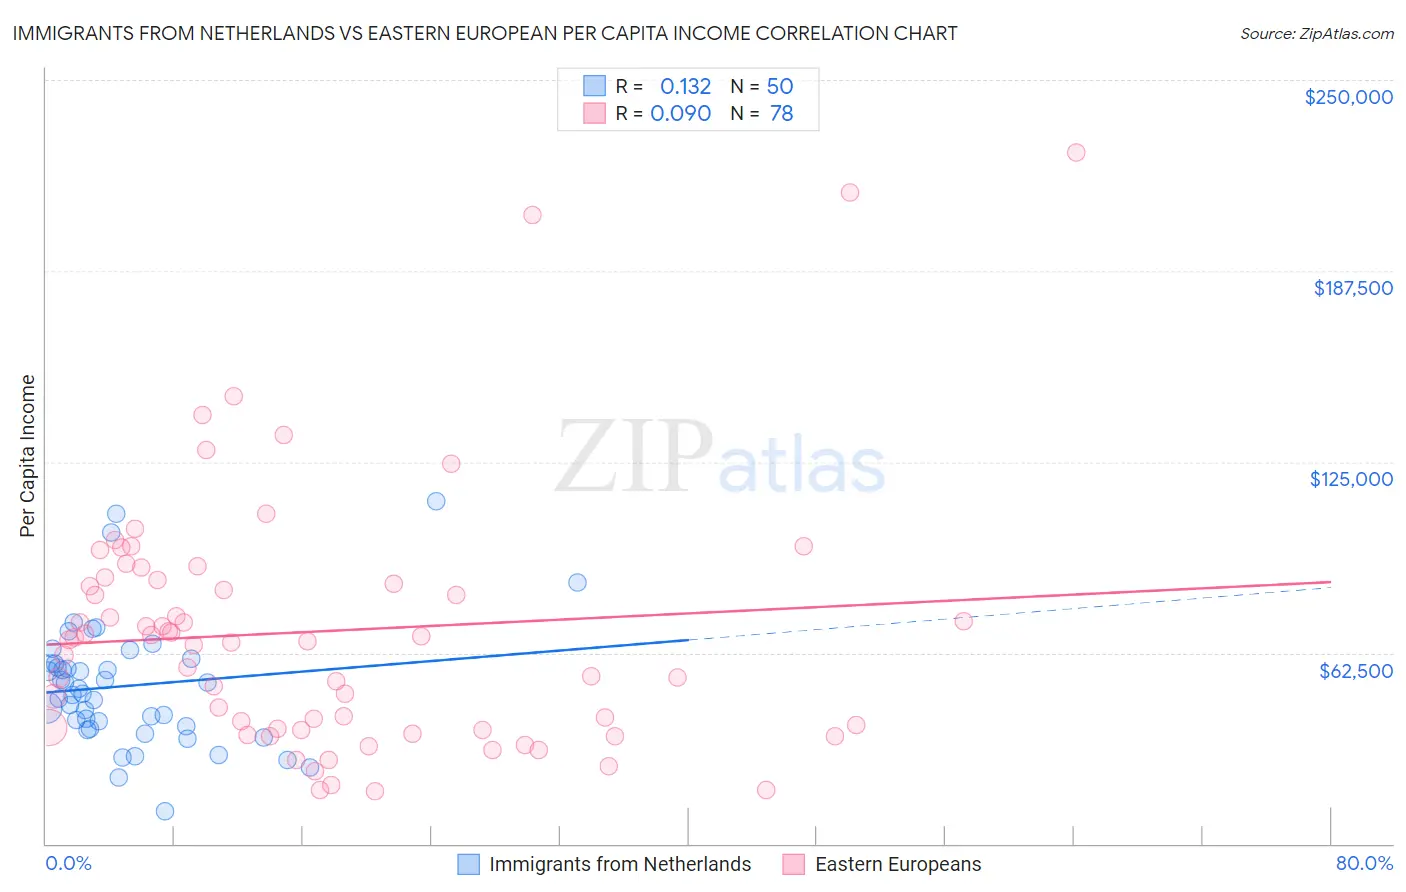
Immigrants from Netherlands vs Eastern European Per Capita Income Correlation Chart
The statistical analysis conducted on geographies consisting of 237,881,407 people shows a poor positive correlation between the proportion of Immigrants from Netherlands and per capita income in the United States with a correlation coefficient (R) of 0.132 and weighted average of $50,458. Similarly, the statistical analysis conducted on geographies consisting of 461,273,443 people shows a slight positive correlation between the proportion of Eastern Europeans and per capita income in the United States with a correlation coefficient (R) of 0.090 and weighted average of $55,780, a difference of 10.5%.
Per Capita Income Correlation Summary
| Measurement | Immigrants from Netherlands | Eastern European |
| Minimum | $10,464 | $17,105 |
| Maximum | $111,976 | $226,072 |
| Range | $101,512 | $208,967 |
| Mean | $51,773 | $69,550 |
| Median | $49,974 | $66,546 |
| Interquartile 25% (IQ1) | $38,654 | $37,574 |
| Interquartile 75% (IQ3) | $59,110 | $86,383 |
| Interquartile Range (IQR) | $20,456 | $48,809 |
| Standard Deviation (Sample) | $20,417 | $42,028 |
| Standard Deviation (Population) | $20,212 | $41,758 |
Similar Demographics by Per Capita Income
Demographics Similar to Immigrants from Netherlands by Per Capita Income
In terms of per capita income, the demographic groups most similar to Immigrants from Netherlands are Immigrants from Croatia ($50,417, a difference of 0.080%), Paraguayan ($50,385, a difference of 0.14%), Immigrants from Sri Lanka ($50,555, a difference of 0.19%), New Zealander ($50,575, a difference of 0.23%), and Immigrants from Belarus ($50,303, a difference of 0.31%).
| Demographics | Rating | Rank | Per Capita Income |
| Immigrants | Europe | 100.0 /100 | #44 | Exceptional $50,950 |
| Immigrants | Spain | 100.0 /100 | #45 | Exceptional $50,933 |
| Immigrants | Latvia | 100.0 /100 | #46 | Exceptional $50,914 |
| Bulgarians | 100.0 /100 | #47 | Exceptional $50,906 |
| Immigrants | Serbia | 100.0 /100 | #48 | Exceptional $50,810 |
| New Zealanders | 100.0 /100 | #49 | Exceptional $50,575 |
| Immigrants | Sri Lanka | 100.0 /100 | #50 | Exceptional $50,555 |
| Immigrants | Netherlands | 100.0 /100 | #51 | Exceptional $50,458 |
| Immigrants | Croatia | 99.9 /100 | #52 | Exceptional $50,417 |
| Paraguayans | 99.9 /100 | #53 | Exceptional $50,385 |
| Immigrants | Belarus | 99.9 /100 | #54 | Exceptional $50,303 |
| Immigrants | Western Europe | 99.9 /100 | #55 | Exceptional $50,065 |
| Asians | 99.9 /100 | #56 | Exceptional $50,057 |
| South Africans | 99.9 /100 | #57 | Exceptional $50,044 |
| Immigrants | Malaysia | 99.9 /100 | #58 | Exceptional $49,983 |
Demographics Similar to Eastern Europeans by Per Capita Income
In terms of per capita income, the demographic groups most similar to Eastern Europeans are Okinawan ($55,817, a difference of 0.070%), Immigrants from Sweden ($55,582, a difference of 0.36%), Immigrants from India ($55,268, a difference of 0.93%), Immigrants from Belgium ($55,082, a difference of 1.3%), and Immigrants from Ireland ($56,584, a difference of 1.4%).
| Demographics | Rating | Rank | Per Capita Income |
| Immigrants | Australia | 100.0 /100 | #4 | Exceptional $57,953 |
| Immigrants | Iran | 100.0 /100 | #5 | Exceptional $57,759 |
| Immigrants | Taiwan | 100.0 /100 | #6 | Exceptional $57,742 |
| Immigrants | Israel | 100.0 /100 | #7 | Exceptional $57,384 |
| Immigrants | Hong Kong | 100.0 /100 | #8 | Exceptional $56,709 |
| Immigrants | Ireland | 100.0 /100 | #9 | Exceptional $56,584 |
| Okinawans | 100.0 /100 | #10 | Exceptional $55,817 |
| Eastern Europeans | 100.0 /100 | #11 | Exceptional $55,780 |
| Immigrants | Sweden | 100.0 /100 | #12 | Exceptional $55,582 |
| Immigrants | India | 100.0 /100 | #13 | Exceptional $55,268 |
| Immigrants | Belgium | 100.0 /100 | #14 | Exceptional $55,082 |
| Cypriots | 100.0 /100 | #15 | Exceptional $54,899 |
| Immigrants | Switzerland | 100.0 /100 | #16 | Exceptional $54,866 |
| Immigrants | France | 100.0 /100 | #17 | Exceptional $54,557 |
| Thais | 100.0 /100 | #18 | Exceptional $54,307 |