Immigrants vs Cherokee Female Disability
COMPARE
Immigrants
Cherokee
Female Disability
Female Disability Comparison
Immigrants
Cherokee
11.7%
FEMALE DISABILITY
98.1/ 100
METRIC RATING
109th/ 347
METRIC RANK
14.9%
FEMALE DISABILITY
0.0/ 100
METRIC RATING
334th/ 347
METRIC RANK
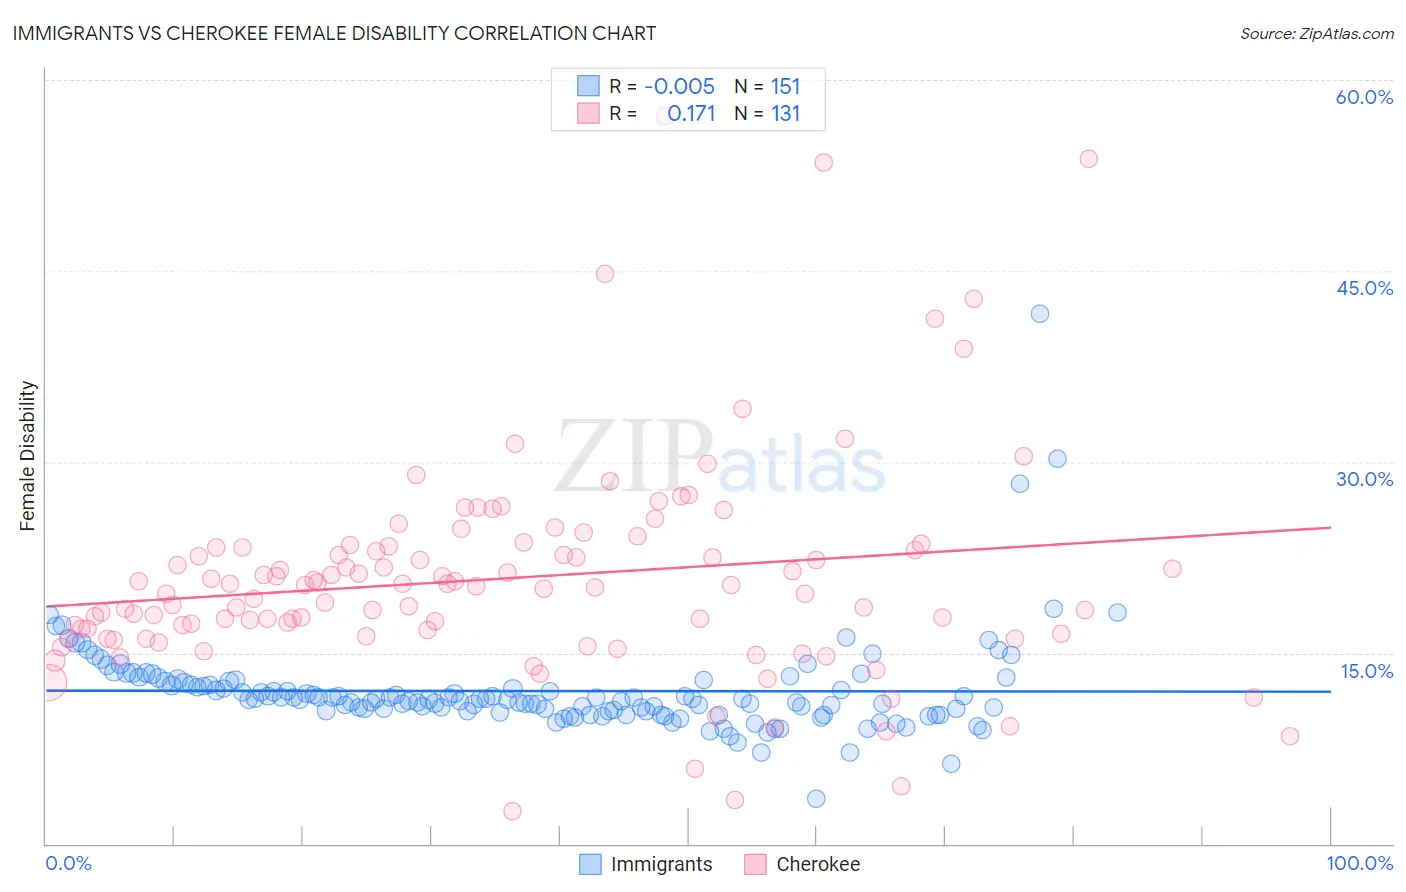
Immigrants vs Cherokee Female Disability Correlation Chart
The statistical analysis conducted on geographies consisting of 577,392,007 people shows no correlation between the proportion of Immigrants and percentage of females with a disability in the United States with a correlation coefficient (R) of -0.005 and weighted average of 11.7%. Similarly, the statistical analysis conducted on geographies consisting of 493,548,902 people shows a poor positive correlation between the proportion of Cherokee and percentage of females with a disability in the United States with a correlation coefficient (R) of 0.171 and weighted average of 14.9%, a difference of 26.6%.
Female Disability Correlation Summary
| Measurement | Immigrants | Cherokee |
| Minimum | 3.5% | 2.6% |
| Maximum | 41.7% | 57.1% |
| Range | 38.2% | 54.6% |
| Mean | 12.0% | 20.9% |
| Median | 11.4% | 20.2% |
| Interquartile 25% (IQ1) | 10.4% | 16.5% |
| Interquartile 75% (IQ3) | 12.7% | 23.3% |
| Interquartile Range (IQR) | 2.2% | 6.8% |
| Standard Deviation (Sample) | 3.9% | 8.5% |
| Standard Deviation (Population) | 3.8% | 8.5% |
Similar Demographics by Female Disability
Demographics Similar to Immigrants by Female Disability
In terms of female disability, the demographic groups most similar to Immigrants are Soviet Union (11.7%, a difference of 0.0%), Costa Rican (11.7%, a difference of 0.020%), New Zealander (11.7%, a difference of 0.030%), Latvian (11.7%, a difference of 0.050%), and Immigrants from Greece (11.7%, a difference of 0.080%).
| Demographics | Rating | Rank | Female Disability |
| Immigrants | South Eastern Asia | 98.4 /100 | #102 | Exceptional 11.7% |
| Immigrants | Eastern Africa | 98.3 /100 | #103 | Exceptional 11.7% |
| Immigrants | Western Asia | 98.3 /100 | #104 | Exceptional 11.7% |
| Australians | 98.3 /100 | #105 | Exceptional 11.7% |
| Immigrants | Greece | 98.2 /100 | #106 | Exceptional 11.7% |
| Latvians | 98.2 /100 | #107 | Exceptional 11.7% |
| New Zealanders | 98.1 /100 | #108 | Exceptional 11.7% |
| Immigrants | Immigrants | 98.1 /100 | #109 | Exceptional 11.7% |
| Soviet Union | 98.1 /100 | #110 | Exceptional 11.7% |
| Costa Ricans | 98.1 /100 | #111 | Exceptional 11.7% |
| Immigrants | Bangladesh | 97.8 /100 | #112 | Exceptional 11.8% |
| Immigrants | Belarus | 97.8 /100 | #113 | Exceptional 11.8% |
| South Africans | 97.7 /100 | #114 | Exceptional 11.8% |
| Brazilians | 97.7 /100 | #115 | Exceptional 11.8% |
| Immigrants | Morocco | 97.6 /100 | #116 | Exceptional 11.8% |
Demographics Similar to Cherokee by Female Disability
In terms of female disability, the demographic groups most similar to Cherokee are Cajun (14.9%, a difference of 0.020%), Immigrants from the Azores (14.9%, a difference of 0.090%), Pima (14.8%, a difference of 0.48%), Seminole (15.0%, a difference of 0.69%), and Tohono O'odham (15.0%, a difference of 0.82%).
| Demographics | Rating | Rank | Female Disability |
| Ottawa | 0.0 /100 | #327 | Tragic 14.2% |
| Cape Verdeans | 0.0 /100 | #328 | Tragic 14.2% |
| Osage | 0.0 /100 | #329 | Tragic 14.3% |
| Yuman | 0.0 /100 | #330 | Tragic 14.5% |
| Immigrants | Cabo Verde | 0.0 /100 | #331 | Tragic 14.6% |
| Pima | 0.0 /100 | #332 | Tragic 14.8% |
| Immigrants | Azores | 0.0 /100 | #333 | Tragic 14.9% |
| Cherokee | 0.0 /100 | #334 | Tragic 14.9% |
| Cajuns | 0.0 /100 | #335 | Tragic 14.9% |
| Seminole | 0.0 /100 | #336 | Tragic 15.0% |
| Tohono O'odham | 0.0 /100 | #337 | Tragic 15.0% |
| Dutch West Indians | 0.0 /100 | #338 | Tragic 15.0% |
| Colville | 0.0 /100 | #339 | Tragic 15.1% |
| Chickasaw | 0.0 /100 | #340 | Tragic 15.2% |
| Choctaw | 0.0 /100 | #341 | Tragic 15.4% |