Immigrants from Zimbabwe vs Salvadoran Median Family Income
COMPARE
Immigrants from Zimbabwe
Salvadoran
Median Family Income
Median Family Income Comparison
Immigrants from Zimbabwe
Salvadorans
$108,830
MEDIAN FAMILY INCOME
95.9/ 100
METRIC RATING
108th/ 347
METRIC RANK
$94,109
MEDIAN FAMILY INCOME
1.2/ 100
METRIC RATING
239th/ 347
METRIC RANK
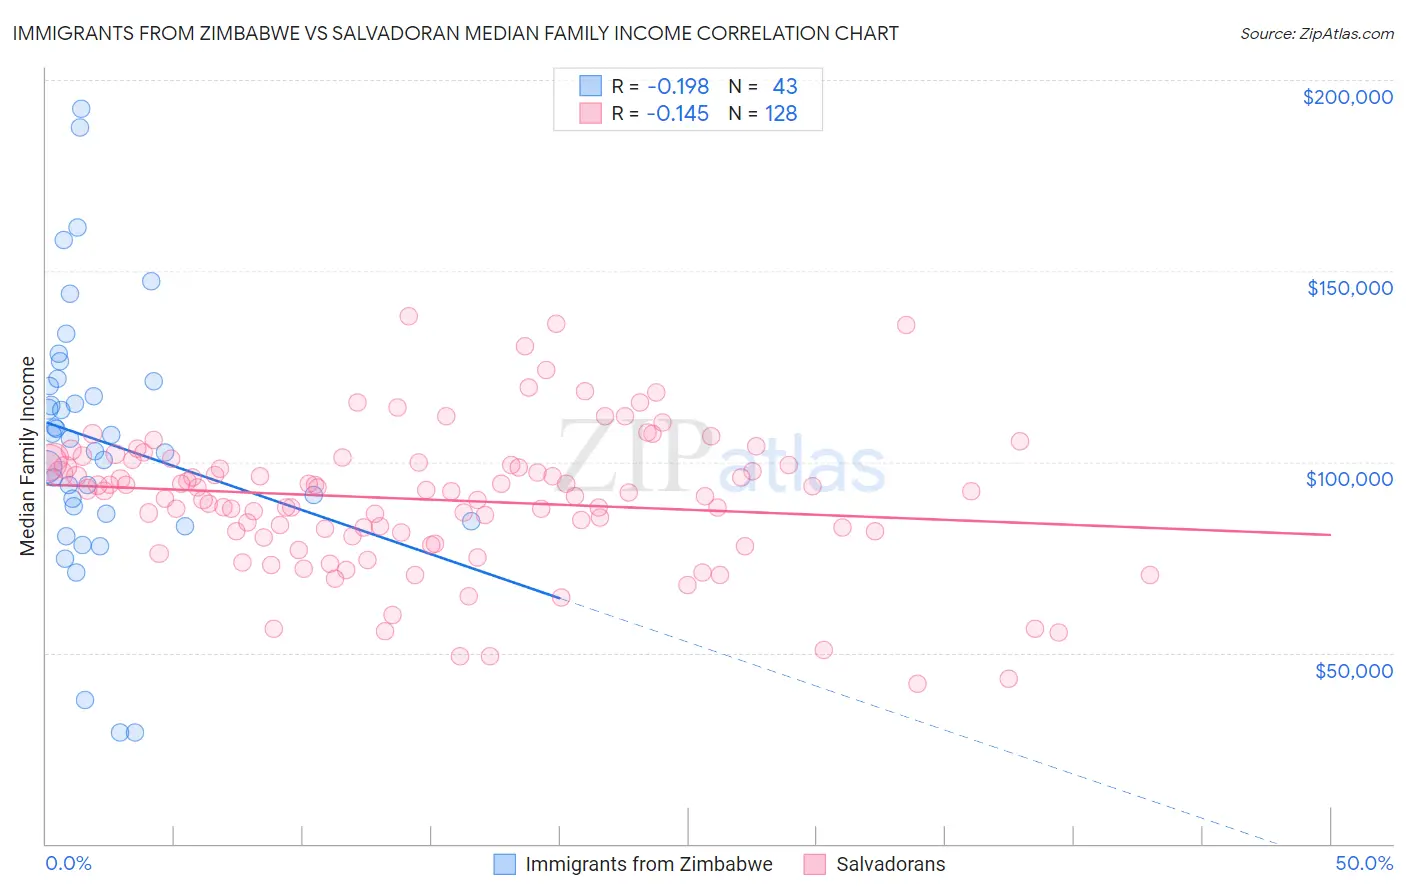
Immigrants from Zimbabwe vs Salvadoran Median Family Income Correlation Chart
The statistical analysis conducted on geographies consisting of 117,781,123 people shows a poor negative correlation between the proportion of Immigrants from Zimbabwe and median family income in the United States with a correlation coefficient (R) of -0.198 and weighted average of $108,830. Similarly, the statistical analysis conducted on geographies consisting of 398,577,694 people shows a poor negative correlation between the proportion of Salvadorans and median family income in the United States with a correlation coefficient (R) of -0.145 and weighted average of $94,109, a difference of 15.6%.
Median Family Income Correlation Summary
| Measurement | Immigrants from Zimbabwe | Salvadoran |
| Minimum | $29,063 | $41,966 |
| Maximum | $192,404 | $138,117 |
| Range | $163,341 | $96,151 |
| Mean | $105,675 | $90,099 |
| Median | $105,969 | $92,329 |
| Interquartile 25% (IQ1) | $86,427 | $81,022 |
| Interquartile 75% (IQ3) | $121,096 | $99,847 |
| Interquartile Range (IQR) | $34,669 | $18,825 |
| Standard Deviation (Sample) | $34,287 | $18,212 |
| Standard Deviation (Population) | $33,886 | $18,141 |
Similar Demographics by Median Family Income
Demographics Similar to Immigrants from Zimbabwe by Median Family Income
In terms of median family income, the demographic groups most similar to Immigrants from Zimbabwe are Immigrants from Afghanistan ($108,709, a difference of 0.11%), British ($108,705, a difference of 0.12%), Immigrants from Western Asia ($108,691, a difference of 0.13%), Immigrants from Poland ($108,570, a difference of 0.24%), and Immigrants from Saudi Arabia ($108,544, a difference of 0.26%).
| Demographics | Rating | Rank | Median Family Income |
| Immigrants | Ukraine | 97.2 /100 | #101 | Exceptional $109,645 |
| Assyrians/Chaldeans/Syriacs | 97.2 /100 | #102 | Exceptional $109,622 |
| Immigrants | Brazil | 96.9 /100 | #103 | Exceptional $109,418 |
| Palestinians | 96.9 /100 | #104 | Exceptional $109,413 |
| Syrians | 96.7 /100 | #105 | Exceptional $109,299 |
| Albanians | 96.4 /100 | #106 | Exceptional $109,136 |
| Immigrants | North Macedonia | 96.4 /100 | #107 | Exceptional $109,136 |
| Immigrants | Zimbabwe | 95.9 /100 | #108 | Exceptional $108,830 |
| Immigrants | Afghanistan | 95.6 /100 | #109 | Exceptional $108,709 |
| British | 95.6 /100 | #110 | Exceptional $108,705 |
| Immigrants | Western Asia | 95.6 /100 | #111 | Exceptional $108,691 |
| Immigrants | Poland | 95.3 /100 | #112 | Exceptional $108,570 |
| Immigrants | Saudi Arabia | 95.2 /100 | #113 | Exceptional $108,544 |
| Poles | 95.2 /100 | #114 | Exceptional $108,507 |
| Swedes | 95.1 /100 | #115 | Exceptional $108,499 |
Demographics Similar to Salvadorans by Median Family Income
In terms of median family income, the demographic groups most similar to Salvadorans are Somali ($94,085, a difference of 0.030%), Nepalese ($94,153, a difference of 0.050%), Immigrants from Trinidad and Tobago ($93,988, a difference of 0.13%), Barbadian ($93,919, a difference of 0.20%), and German Russian ($93,858, a difference of 0.27%).
| Demographics | Rating | Rank | Median Family Income |
| Immigrants | Venezuela | 1.9 /100 | #232 | Tragic $94,904 |
| Immigrants | Bangladesh | 1.6 /100 | #233 | Tragic $94,665 |
| Immigrants | Western Africa | 1.6 /100 | #234 | Tragic $94,638 |
| Immigrants | Burma/Myanmar | 1.5 /100 | #235 | Tragic $94,472 |
| Trinidadians and Tobagonians | 1.5 /100 | #236 | Tragic $94,466 |
| Alaskan Athabascans | 1.5 /100 | #237 | Tragic $94,429 |
| Nepalese | 1.3 /100 | #238 | Tragic $94,153 |
| Salvadorans | 1.2 /100 | #239 | Tragic $94,109 |
| Somalis | 1.2 /100 | #240 | Tragic $94,085 |
| Immigrants | Trinidad and Tobago | 1.2 /100 | #241 | Tragic $93,988 |
| Barbadians | 1.1 /100 | #242 | Tragic $93,919 |
| German Russians | 1.1 /100 | #243 | Tragic $93,858 |
| Sub-Saharan Africans | 1.0 /100 | #244 | Tragic $93,748 |
| Immigrants | Middle Africa | 1.0 /100 | #245 | Tragic $93,593 |
| Guyanese | 0.9 /100 | #246 | Tragic $93,373 |