Immigrants from Zimbabwe vs Immigrants from Ethiopia Median Family Income
COMPARE
Immigrants from Zimbabwe
Immigrants from Ethiopia
Median Family Income
Median Family Income Comparison
Immigrants from Zimbabwe
Immigrants from Ethiopia
$108,830
MEDIAN FAMILY INCOME
95.9/ 100
METRIC RATING
108th/ 347
METRIC RANK
$106,969
MEDIAN FAMILY INCOME
90.0/ 100
METRIC RATING
128th/ 347
METRIC RANK
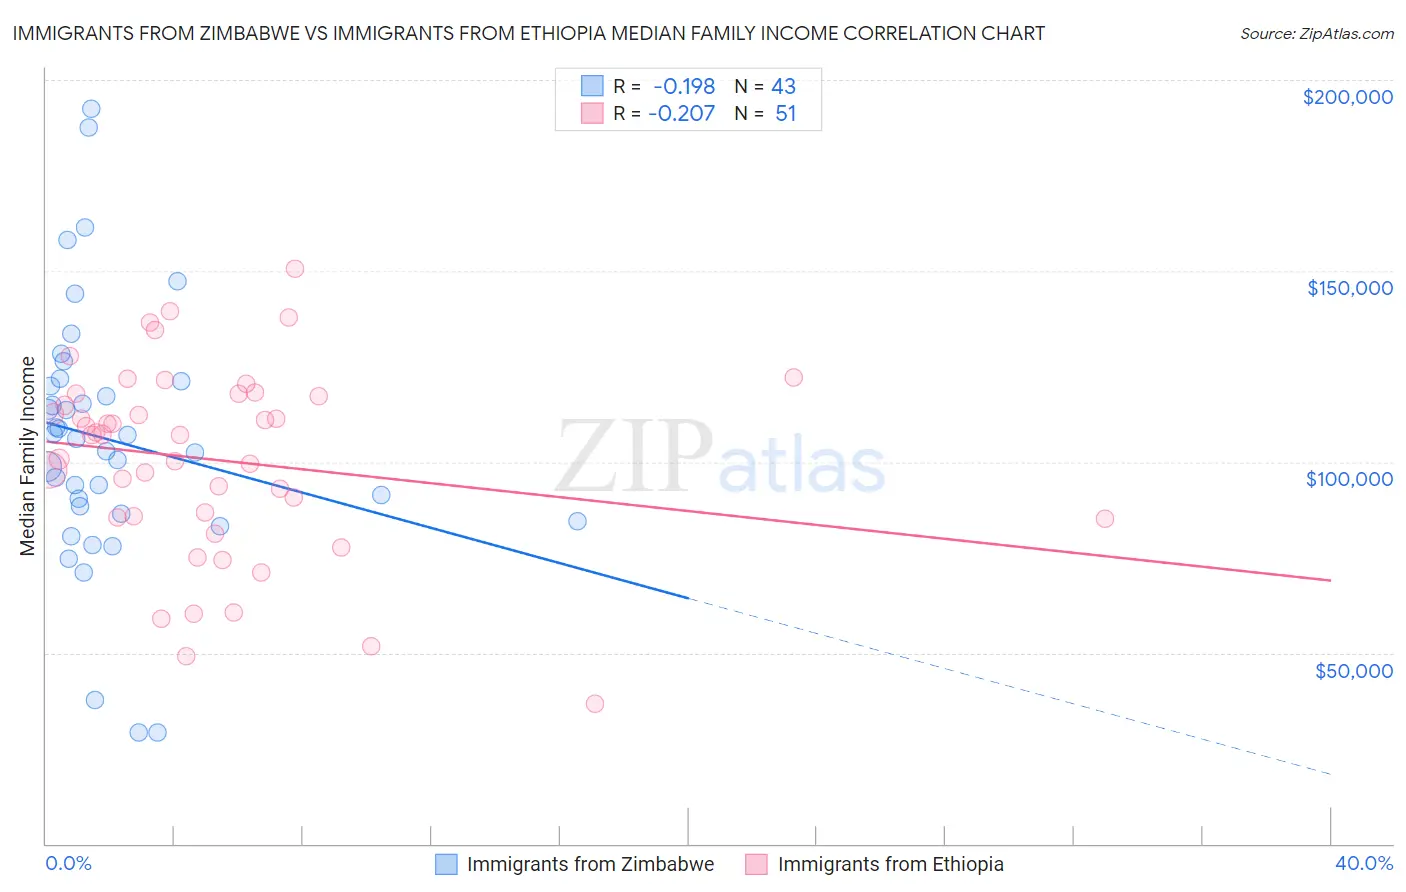
Immigrants from Zimbabwe vs Immigrants from Ethiopia Median Family Income Correlation Chart
The statistical analysis conducted on geographies consisting of 117,781,123 people shows a poor negative correlation between the proportion of Immigrants from Zimbabwe and median family income in the United States with a correlation coefficient (R) of -0.198 and weighted average of $108,830. Similarly, the statistical analysis conducted on geographies consisting of 211,422,914 people shows a weak negative correlation between the proportion of Immigrants from Ethiopia and median family income in the United States with a correlation coefficient (R) of -0.207 and weighted average of $106,969, a difference of 1.7%.
Median Family Income Correlation Summary
| Measurement | Immigrants from Zimbabwe | Immigrants from Ethiopia |
| Minimum | $29,063 | $36,544 |
| Maximum | $192,404 | $150,528 |
| Range | $163,341 | $113,984 |
| Mean | $105,675 | $100,429 |
| Median | $105,969 | $107,133 |
| Interquartile 25% (IQ1) | $86,427 | $85,358 |
| Interquartile 75% (IQ3) | $121,096 | $117,899 |
| Interquartile Range (IQR) | $34,669 | $32,541 |
| Standard Deviation (Sample) | $34,287 | $24,958 |
| Standard Deviation (Population) | $33,886 | $24,712 |
Demographics Similar to Immigrants from Zimbabwe and Immigrants from Ethiopia by Median Family Income
In terms of median family income, the demographic groups most similar to Immigrants from Zimbabwe are Immigrants from Afghanistan ($108,709, a difference of 0.11%), British ($108,705, a difference of 0.12%), Immigrants from Western Asia ($108,691, a difference of 0.13%), Immigrants from Poland ($108,570, a difference of 0.24%), and Immigrants from Saudi Arabia ($108,544, a difference of 0.26%). Similarly, the demographic groups most similar to Immigrants from Ethiopia are Lebanese ($107,086, a difference of 0.11%), Serbian ($107,157, a difference of 0.18%), Taiwanese ($107,295, a difference of 0.30%), Pakistani ($107,390, a difference of 0.39%), and Carpatho Rusyn ($107,502, a difference of 0.50%).
| Demographics | Rating | Rank | Median Family Income |
| Immigrants | Zimbabwe | 95.9 /100 | #108 | Exceptional $108,830 |
| Immigrants | Afghanistan | 95.6 /100 | #109 | Exceptional $108,709 |
| British | 95.6 /100 | #110 | Exceptional $108,705 |
| Immigrants | Western Asia | 95.6 /100 | #111 | Exceptional $108,691 |
| Immigrants | Poland | 95.3 /100 | #112 | Exceptional $108,570 |
| Immigrants | Saudi Arabia | 95.2 /100 | #113 | Exceptional $108,544 |
| Poles | 95.2 /100 | #114 | Exceptional $108,507 |
| Swedes | 95.1 /100 | #115 | Exceptional $108,499 |
| Chileans | 95.0 /100 | #116 | Exceptional $108,429 |
| Immigrants | Philippines | 94.6 /100 | #117 | Exceptional $108,288 |
| Ethiopians | 94.5 /100 | #118 | Exceptional $108,251 |
| Sri Lankans | 94.5 /100 | #119 | Exceptional $108,234 |
| Immigrants | Northern Africa | 94.3 /100 | #120 | Exceptional $108,161 |
| Europeans | 94.1 /100 | #121 | Exceptional $108,099 |
| Immigrants | Jordan | 92.9 /100 | #122 | Exceptional $107,715 |
| Carpatho Rusyns | 92.2 /100 | #123 | Exceptional $107,502 |
| Pakistanis | 91.7 /100 | #124 | Exceptional $107,390 |
| Taiwanese | 91.4 /100 | #125 | Exceptional $107,295 |
| Serbians | 90.8 /100 | #126 | Exceptional $107,157 |
| Lebanese | 90.5 /100 | #127 | Exceptional $107,086 |
| Immigrants | Ethiopia | 90.0 /100 | #128 | Excellent $106,969 |