Immigrants from Nigeria vs Salvadoran Median Family Income
COMPARE
Immigrants from Nigeria
Salvadoran
Median Family Income
Median Family Income Comparison
Immigrants from Nigeria
Salvadorans
$96,439
MEDIAN FAMILY INCOME
4.0/ 100
METRIC RATING
222nd/ 347
METRIC RANK
$94,109
MEDIAN FAMILY INCOME
1.2/ 100
METRIC RATING
239th/ 347
METRIC RANK
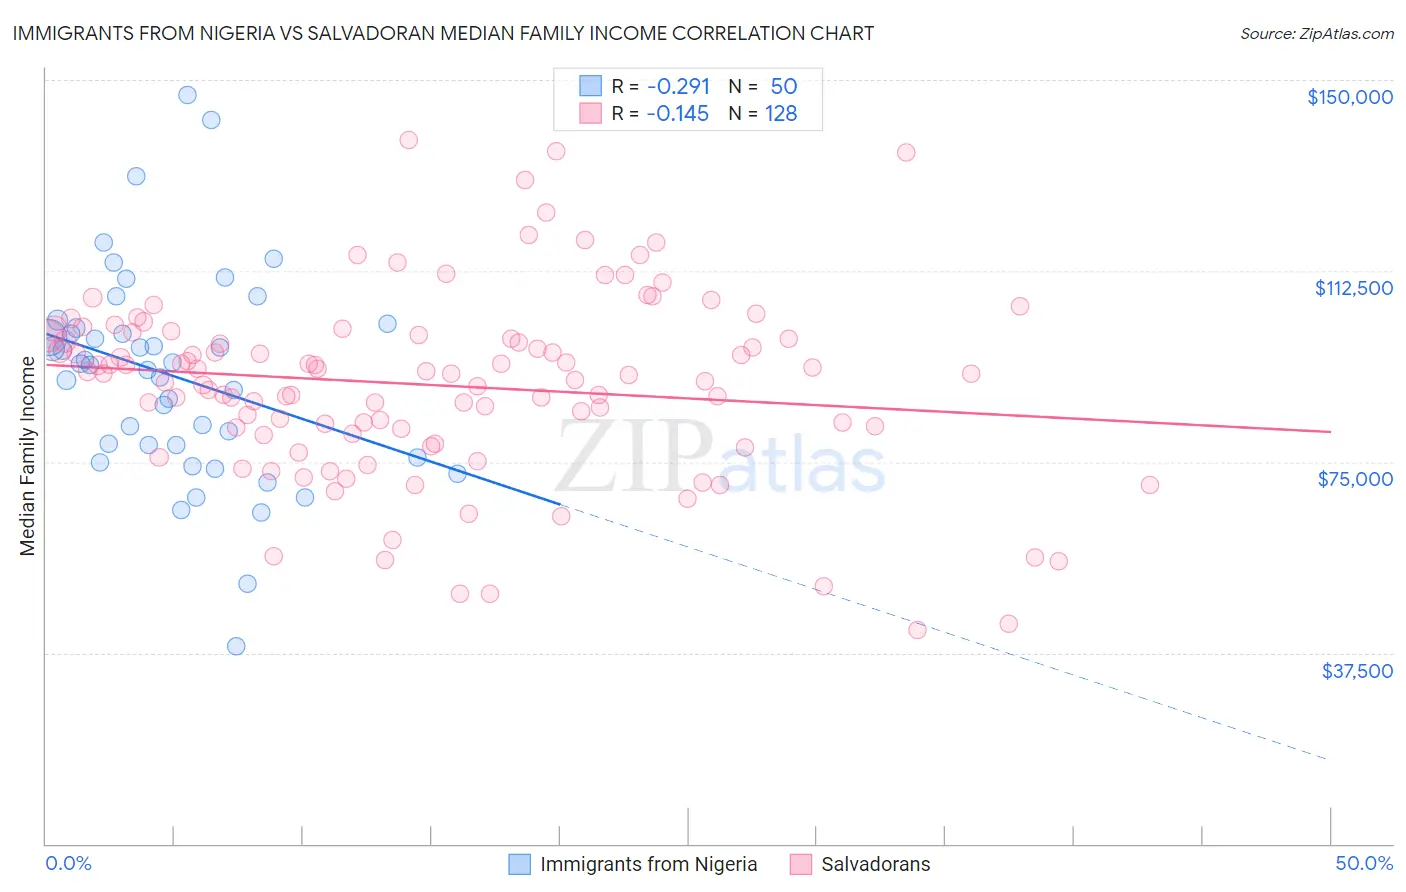
Immigrants from Nigeria vs Salvadoran Median Family Income Correlation Chart
The statistical analysis conducted on geographies consisting of 283,210,915 people shows a weak negative correlation between the proportion of Immigrants from Nigeria and median family income in the United States with a correlation coefficient (R) of -0.291 and weighted average of $96,439. Similarly, the statistical analysis conducted on geographies consisting of 398,577,694 people shows a poor negative correlation between the proportion of Salvadorans and median family income in the United States with a correlation coefficient (R) of -0.145 and weighted average of $94,109, a difference of 2.5%.
Median Family Income Correlation Summary
| Measurement | Immigrants from Nigeria | Salvadoran |
| Minimum | $38,750 | $41,966 |
| Maximum | $147,129 | $138,117 |
| Range | $108,379 | $96,151 |
| Mean | $91,848 | $90,099 |
| Median | $94,194 | $92,329 |
| Interquartile 25% (IQ1) | $78,280 | $81,022 |
| Interquartile 75% (IQ3) | $101,295 | $99,847 |
| Interquartile Range (IQR) | $23,014 | $18,825 |
| Standard Deviation (Sample) | $20,578 | $18,212 |
| Standard Deviation (Population) | $20,371 | $18,141 |
Demographics Similar to Immigrants from Nigeria and Salvadorans by Median Family Income
In terms of median family income, the demographic groups most similar to Immigrants from Nigeria are Immigrants from Ghana ($96,544, a difference of 0.11%), Venezuelan ($96,281, a difference of 0.16%), Nonimmigrants ($96,231, a difference of 0.22%), Vietnamese ($96,123, a difference of 0.33%), and Sudanese ($96,783, a difference of 0.36%). Similarly, the demographic groups most similar to Salvadorans are Somali ($94,085, a difference of 0.030%), Nepalese ($94,153, a difference of 0.050%), Alaskan Athabascan ($94,429, a difference of 0.34%), Immigrants from Burma/Myanmar ($94,472, a difference of 0.38%), and Trinidadian and Tobagonian ($94,466, a difference of 0.38%).
| Demographics | Rating | Rank | Median Family Income |
| Sudanese | 4.7 /100 | #220 | Tragic $96,783 |
| Immigrants | Ghana | 4.2 /100 | #221 | Tragic $96,544 |
| Immigrants | Nigeria | 4.0 /100 | #222 | Tragic $96,439 |
| Venezuelans | 3.7 /100 | #223 | Tragic $96,281 |
| Immigrants | Nonimmigrants | 3.6 /100 | #224 | Tragic $96,231 |
| Vietnamese | 3.4 /100 | #225 | Tragic $96,123 |
| Immigrants | Panama | 2.7 /100 | #226 | Tragic $95,647 |
| Alaska Natives | 2.6 /100 | #227 | Tragic $95,573 |
| Immigrants | Azores | 2.4 /100 | #228 | Tragic $95,402 |
| Marshallese | 2.2 /100 | #229 | Tragic $95,293 |
| Malaysians | 2.2 /100 | #230 | Tragic $95,230 |
| Ecuadorians | 2.1 /100 | #231 | Tragic $95,114 |
| Immigrants | Venezuela | 1.9 /100 | #232 | Tragic $94,904 |
| Immigrants | Bangladesh | 1.6 /100 | #233 | Tragic $94,665 |
| Immigrants | Western Africa | 1.6 /100 | #234 | Tragic $94,638 |
| Immigrants | Burma/Myanmar | 1.5 /100 | #235 | Tragic $94,472 |
| Trinidadians and Tobagonians | 1.5 /100 | #236 | Tragic $94,466 |
| Alaskan Athabascans | 1.5 /100 | #237 | Tragic $94,429 |
| Nepalese | 1.3 /100 | #238 | Tragic $94,153 |
| Salvadorans | 1.2 /100 | #239 | Tragic $94,109 |
| Somalis | 1.2 /100 | #240 | Tragic $94,085 |