Immigrants from Zimbabwe vs Estonian Median Family Income
COMPARE
Immigrants from Zimbabwe
Estonian
Median Family Income
Median Family Income Comparison
Immigrants from Zimbabwe
Estonians
$108,830
MEDIAN FAMILY INCOME
95.9/ 100
METRIC RATING
108th/ 347
METRIC RANK
$118,013
MEDIAN FAMILY INCOME
100.0/ 100
METRIC RATING
41st/ 347
METRIC RANK
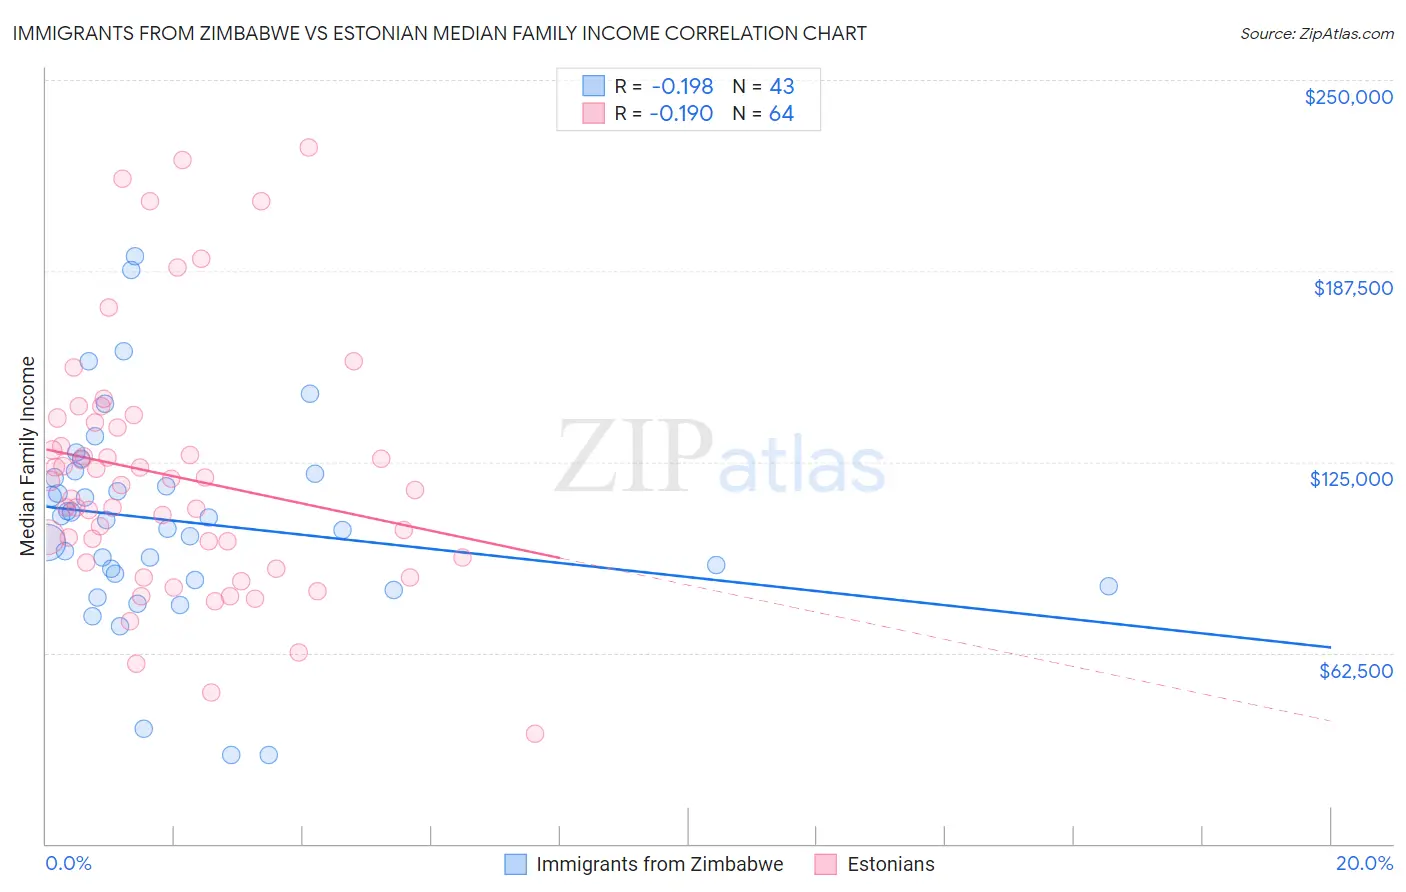
Immigrants from Zimbabwe vs Estonian Median Family Income Correlation Chart
The statistical analysis conducted on geographies consisting of 117,781,123 people shows a poor negative correlation between the proportion of Immigrants from Zimbabwe and median family income in the United States with a correlation coefficient (R) of -0.198 and weighted average of $108,830. Similarly, the statistical analysis conducted on geographies consisting of 123,476,939 people shows a poor negative correlation between the proportion of Estonians and median family income in the United States with a correlation coefficient (R) of -0.190 and weighted average of $118,013, a difference of 8.4%.
Median Family Income Correlation Summary
| Measurement | Immigrants from Zimbabwe | Estonian |
| Minimum | $29,063 | $35,938 |
| Maximum | $192,404 | $228,043 |
| Range | $163,341 | $192,105 |
| Mean | $105,675 | $120,304 |
| Median | $105,969 | $116,733 |
| Interquartile 25% (IQ1) | $86,427 | $92,790 |
| Interquartile 75% (IQ3) | $121,096 | $137,031 |
| Interquartile Range (IQR) | $34,669 | $44,241 |
| Standard Deviation (Sample) | $34,287 | $41,178 |
| Standard Deviation (Population) | $33,886 | $40,855 |
Similar Demographics by Median Family Income
Demographics Similar to Immigrants from Zimbabwe by Median Family Income
In terms of median family income, the demographic groups most similar to Immigrants from Zimbabwe are Immigrants from Afghanistan ($108,709, a difference of 0.11%), British ($108,705, a difference of 0.12%), Immigrants from Western Asia ($108,691, a difference of 0.13%), Immigrants from Poland ($108,570, a difference of 0.24%), and Immigrants from Saudi Arabia ($108,544, a difference of 0.26%).
| Demographics | Rating | Rank | Median Family Income |
| Immigrants | Ukraine | 97.2 /100 | #101 | Exceptional $109,645 |
| Assyrians/Chaldeans/Syriacs | 97.2 /100 | #102 | Exceptional $109,622 |
| Immigrants | Brazil | 96.9 /100 | #103 | Exceptional $109,418 |
| Palestinians | 96.9 /100 | #104 | Exceptional $109,413 |
| Syrians | 96.7 /100 | #105 | Exceptional $109,299 |
| Albanians | 96.4 /100 | #106 | Exceptional $109,136 |
| Immigrants | North Macedonia | 96.4 /100 | #107 | Exceptional $109,136 |
| Immigrants | Zimbabwe | 95.9 /100 | #108 | Exceptional $108,830 |
| Immigrants | Afghanistan | 95.6 /100 | #109 | Exceptional $108,709 |
| British | 95.6 /100 | #110 | Exceptional $108,705 |
| Immigrants | Western Asia | 95.6 /100 | #111 | Exceptional $108,691 |
| Immigrants | Poland | 95.3 /100 | #112 | Exceptional $108,570 |
| Immigrants | Saudi Arabia | 95.2 /100 | #113 | Exceptional $108,544 |
| Poles | 95.2 /100 | #114 | Exceptional $108,507 |
| Swedes | 95.1 /100 | #115 | Exceptional $108,499 |
Demographics Similar to Estonians by Median Family Income
In terms of median family income, the demographic groups most similar to Estonians are Immigrants from Lithuania ($118,053, a difference of 0.030%), Immigrants from Bolivia ($117,912, a difference of 0.090%), Bulgarian ($117,818, a difference of 0.17%), Cambodian ($117,780, a difference of 0.20%), and Immigrants from Asia ($118,291, a difference of 0.24%).
| Demographics | Rating | Rank | Median Family Income |
| Bolivians | 100.0 /100 | #34 | Exceptional $119,479 |
| Soviet Union | 100.0 /100 | #35 | Exceptional $119,262 |
| Israelis | 100.0 /100 | #36 | Exceptional $118,577 |
| Australians | 100.0 /100 | #37 | Exceptional $118,440 |
| Immigrants | Turkey | 100.0 /100 | #38 | Exceptional $118,325 |
| Immigrants | Asia | 100.0 /100 | #39 | Exceptional $118,291 |
| Immigrants | Lithuania | 100.0 /100 | #40 | Exceptional $118,053 |
| Estonians | 100.0 /100 | #41 | Exceptional $118,013 |
| Immigrants | Bolivia | 100.0 /100 | #42 | Exceptional $117,912 |
| Bulgarians | 100.0 /100 | #43 | Exceptional $117,818 |
| Cambodians | 100.0 /100 | #44 | Exceptional $117,780 |
| Immigrants | Greece | 99.9 /100 | #45 | Exceptional $117,344 |
| Immigrants | Russia | 99.9 /100 | #46 | Exceptional $116,942 |
| Immigrants | Austria | 99.9 /100 | #47 | Exceptional $116,830 |
| Immigrants | South Africa | 99.9 /100 | #48 | Exceptional $116,286 |